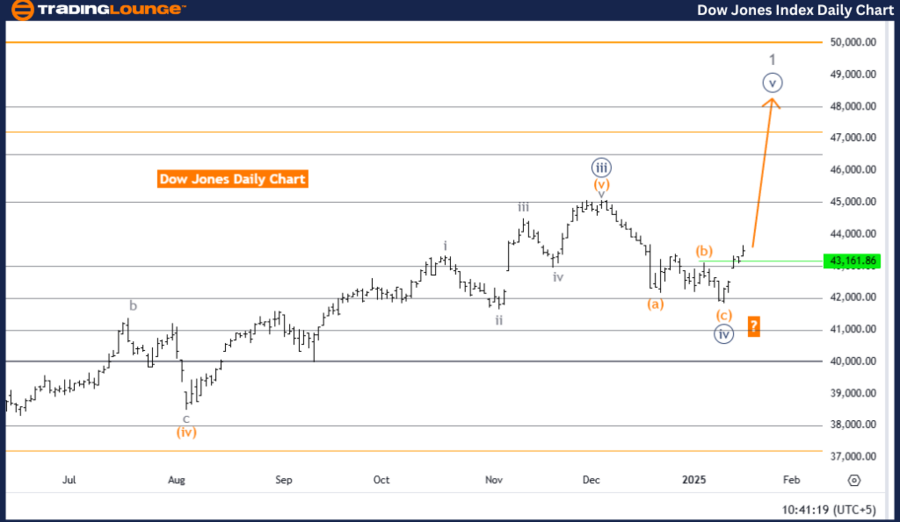
DOW JONES - DJI Elliott Wave Analysis | Trading Lounge Daily Chart
DOW JONES - DJI Elliott Wave Technical Analysis Overview
Function: Bullish Trend
Mode: Impulsive
Structure: Navy Blue Wave 5
Position: Gray Wave 1
Direction Next Higher Degrees: Navy Blue Wave 5 (In Progress)
Details: Navy Blue Wave 4 completion confirmed; Navy Blue Wave 5 currently active.
Wave Cancel Invalid Level: 41822.71
The Dow Jones Industrial Average (DJI) daily chart presents a bullish Elliott Wave structure, currently in an impulsive phase, driven by the progression of navy blue wave five, which follows the successful completion of navy blue wave four. This indicates the initiation of a new upward trend, reinforcing market strength.
Presently, the market position aligns with gray wave one, marking the onset of navy blue wave five’s journey. This suggests sustained bullish momentum, with further upward movement expected as long as the wave count remains intact.
The critical invalidation level is 41822.71, meaning a drop below this threshold would negate the current wave structure, prompting a reassessment. As long as the price stays above this key level, the bullish trajectory is likely to continue, with wave five targeting new highs.
The current phase within Elliott Wave theory plays a significant role in confirming long-term market direction. Close monitoring of price action and wave behavior will be essential in validating the continuation of this upward trend.
Conclusion
In summary, the Dow Jones daily Elliott Wave analysis indicates an ongoing bullish trend, with navy blue wave five extending upward after completing navy blue wave four. The current wave position is gray wave one, suggesting the early stages of further gains. The invalidation level at 41822.71 remains a critical marker for wave count validity, ensuring the bullish outlook stays intact.
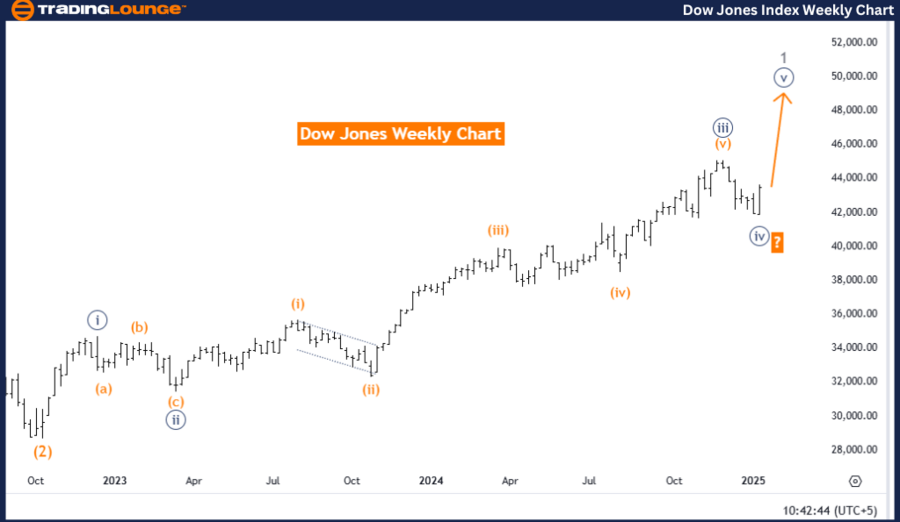
DOW JONES - DJI Elliott Wave Analysis | Trading Lounge Weekly Chart
DOW JONES - DJI Elliott Wave Technical Analysis Overview
Function: Bullish Trend
Mode: Impulsive
Structure: Navy Blue Wave 5
Position: Gray Wave 1
Direction Next Higher Degrees: Navy Blue Wave 5 (In Progress)
Details: Navy Blue Wave 4 completion confirmed; Navy Blue Wave 5 currently active.
Wave Cancel Invalid Level: 41822.71
The Dow Jones weekly chart analysis showcases a persistent bullish trend within the Elliott Wave framework, with the market currently in the impulsive navy blue wave five phase. Following the completion of navy blue wave four, the current structure suggests an upward trajectory in alignment with long-term bullish projections.
At this point, the position aligns with gray wave one, marking the beginning of an extended upward movement. This phase confirms the early progression within navy blue wave five and aligns with the broader bullish sentiment prevailing in the market.
The wave count’s invalidation level is maintained at 41822.71, ensuring that any decline below this figure would require a revised analysis. However, as long as the price sustains above this level, the ongoing bullish structure remains valid, with expectations of further gains.
This wave phase is crucial in the broader Elliott Wave sequence, highlighting a potential surge to new market highs. Careful observation of price dynamics and wave formations will help validate the bullish outlook and confirm successful wave completion.
Conclusion
In conclusion, the Dow Jones weekly Elliott Wave outlook supports a bullish market stance, with navy blue wave five advancing after the completion of navy blue wave four. The ongoing wave count at gray wave one suggests the early stage of an extended upward trend. The key reference point for maintaining this structure's validity is the 41822.71 level, which ensures the bullish forecast remains on track.
Technical Analyst: Malik Awais
Source: visit Tradinglounge.com and learn From the Experts Join TradingLounge Here
Previous: FTSE 100 (UK) Elliott Wave Technical Analysis
VALUE Offer - Buy 1 Month & Get 3 Months!Click here
Access 7 Analysts Over 200 Markets Covered. Chat Room With Support