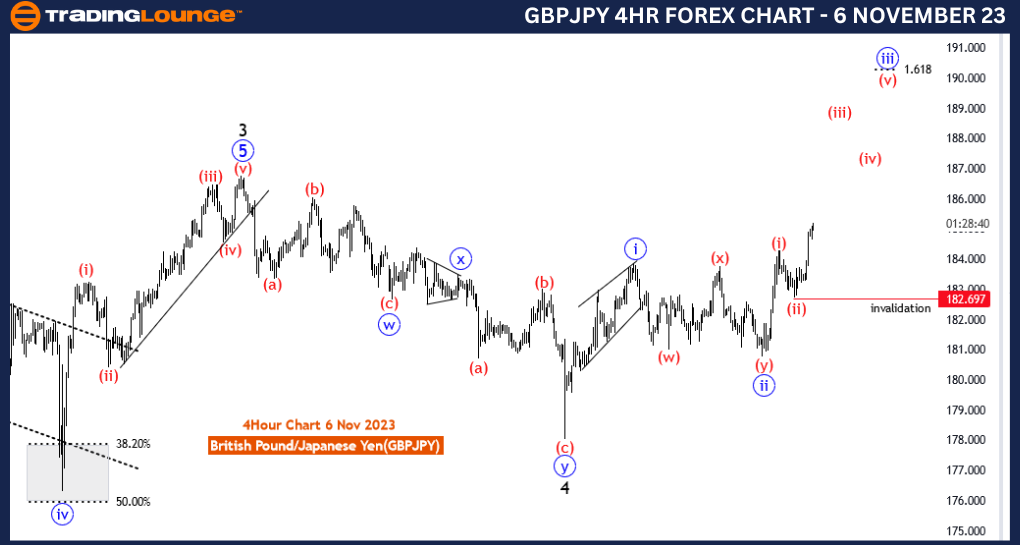
GBPJPY Elliott Wave Analysis Trading Lounge 4 Hour Chart, 6 November 23
British Pound/Japanese Yen(GBPJPY) 4 Hour Chart
GBPJPY Elliott Wave Technical Analysis
Function: Trend
Mode: impulsive
Structure: blue wave 3 of 5
Position: Black wave 5
Direction Next Higher Degrees: blue wave 3 (continue)
Details: Corrective wave 2 looking completed at 180.797 , now wave 3 of 5 is in play very strongly. Wave Cancel invalid level: 182.697
The "GBPJPY Elliott Wave Analysis Trading Lounge 4 Hour Chart" dated 6 November 23, provides a comprehensive analysis of the price movements for the British Pound/Japanese Yen (GBP/JPY) currency pair on a 4-hour chart. This analysis is invaluable for traders and investors seeking to gain insights into the potential market developments based on Elliott Wave theory.
The primary function of the market, as described in this analysis, is "Trend." This indicates that the GBP/JPY pair is currently in a trend phase, moving persistently in a specific direction. The market sentiment suggests a strong preference for this particular trend.
The "Mode" of the analysis is categorized as "impulsive." Impulsive waves in Elliott Wave theory represent strong and sustained price movements in the direction of the prevailing trend. In this context, the impulsive mode is designated as "blue wave 3 of 5," indicating a potent and progressive wave within the overall wave structure.
The central focus of this analysis is on "blue wave 3," a powerful wave within the broader structure. The completion of "Corrective wave 2" is marked at the price level of 180.797. This indicates the end of wave 2, and the market is now advancing into "wave 3 of 5."
What makes this analysis particularly significant is its projection of continued bullish momentum. The "Direction" specified is "Next Higher Degrees: blue wave 3 (continue)." This suggests that the GBP/JPY market is expected to maintain its strong upward movement as wave 3 unfolds further.
The "Wave Cancel invalid level" is denoted as 182.697. This level is critical for traders as it defines an essential threshold for risk management. Should the market approach or surpass this level, it may trigger a reconsideration of the current wave count and trading strategies.
In conclusion, the GBP/JPY Elliott Wave Analysis on the 4-hour chart, dated 6 November 23, paints a bullish picture. After the completion of corrective wave 2, the GBP/JPY currency pair is projected to continue its upward trajectory with the strong wave 3. Traders should closely monitor the wave cancel invalid level to manage risks effectively. This analysis serves as a vital resource for market participants looking to capitalize on trading opportunities in the GBP/JPY market.
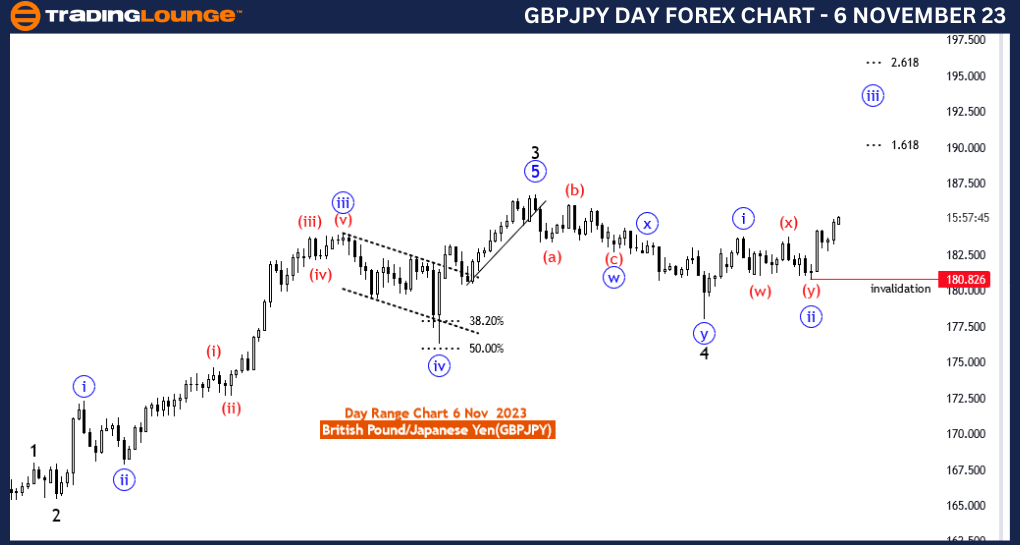
GBPJPY Elliott Wave Analysis Trading Lounge Day Chart, 6 November 23
British Pound/Japanese Yen(GBPJPY) Day Chart
GBPJPY Elliott Wave Technical Analysis
Function: Trend
Mode: impulsive
Structure: blue wave 3 of 5
Position: Black wave 5
Direction Next Higher Degrees: blue wave 3 (continue)
Details: Corrective wave 2 looking completed at 180.797 , now wave 3 of 5 is in play very strongly. Wave Cancel invalid level: 180.826
The "GBPJPY Elliott Wave Analysis Trading Lounge Day Chart" dated 6 November 23, presents a comprehensive analysis of the British Pound/Japanese Yen (GBP/JPY) currency pair's price action on a daily chart. This analysis is particularly valuable for traders and investors who seek insights into potential market movements based on Elliott Wave theory.
The primary function attributed to the market in this analysis is "Trend." This suggests that the GBP/JPY currency pair is currently experiencing a trend phase, with prices moving consistently in a particular direction. The trend reflects the market's prevailing sentiment, indicating a strong preference for this directional movement.
The "Mode" of the analysis is categorized as "impulsive." In Elliott Wave theory, impulsive waves represent robust and sustained price movements in the direction of the dominant trend. In this context, the mode is described as "blue wave 3 of 5," signifying a potent and progressive wave within the broader wave structure.
The analysis zeroes in on "blue wave 3," highlighting its significance within the larger wave framework. The completion of "Corrective wave 2" is identified at a price level of 180.797. This suggests that wave 2 has concluded, and the market is now advancing into "wave 3 of 5."
This analysis holds particular importance due to its projection of ongoing bullish momentum. The specified "Direction" is "Next Higher Degrees: blue wave 3 (continue)." This indicates the expectation of a continued upward trajectory for the GBP/JPY market as wave 3 unfolds further.
The "Wave Cancel invalid level" is pinpointed at 180.826. This level is crucial for traders as it establishes a vital threshold for risk management. If the market approaches or surpasses this level, it may necessitate a reassessment of the current wave count and trading strategies.
In conclusion, the GBP/JPY Elliott Wave Analysis on the daily chart, dated 6 November 23, paints a bullish outlook. With the completion of corrective wave 2, the GBP/JPY currency pair is anticipated to maintain its strong upward movement as wave 3 continues to develop. Traders should closely monitor the wave cancel invalid level to effectively manage their risks. This analysis serves as a critical resource for market participants seeking to capitalize on trading opportunities within the GBP/JPY market.