Elliott Wave Analysis of Netflix Inc. (NFLX) Stock

In this Elliott Wave analysis of Netflix Inc. (NFLX), we examine its recent price movement using Elliott Wave Theory to help traders identify potential trading opportunities. Both the daily and 1-hour charts provide a comprehensive view of NFLX’s trend and wave structure.

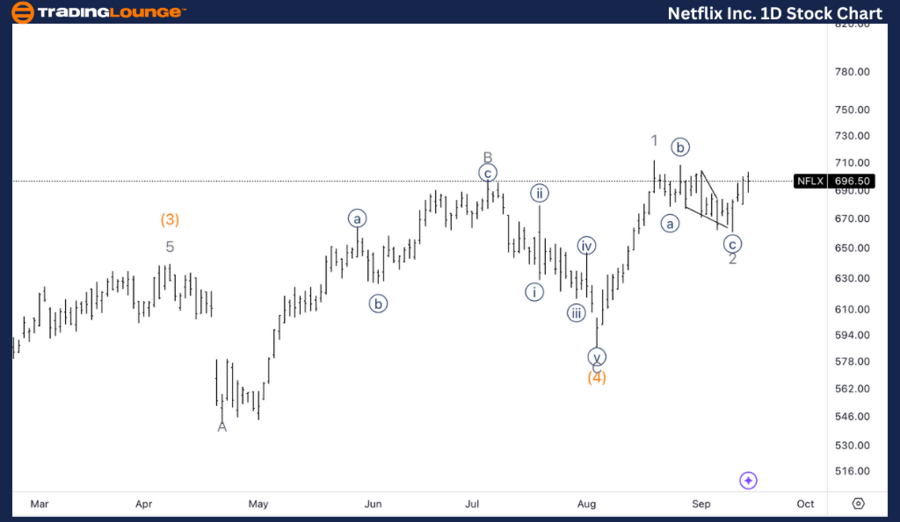
NFLX Elliott Wave Analysis Trading Lounge Daily Chart

Netflix Inc. (NFLX) Daily Chart Analysis

NFLX Elliott Wave Technical Analysis

  • Function: Trend
  • Mode: Impulsive
  • Structure: Motive
  • Position: Wave 3
  • Direction: Upside in Wave 3

Details: We are looking for a bottom in Wave 2 to be confirmed, with upside movement expected in Wave 3 of (5). The minimum target is TradingLevel 8 (TL8) at $800.

NFLX Stock Technical Analysis with Daily Chart

On the daily chart, Netflix is clearly in an impulsive mode, advancing within Wave 3 of (5). The stock appears to have completed its Wave 2 correction and is now entering Wave 3, which is typically the strongest and most extended part of an impulsive wave structure. The initial upside target for Wave 3 is TradingLevel 8 (TL8) at $800, a key psychological and technical level.

Netflix-Inc-1D-Stock...


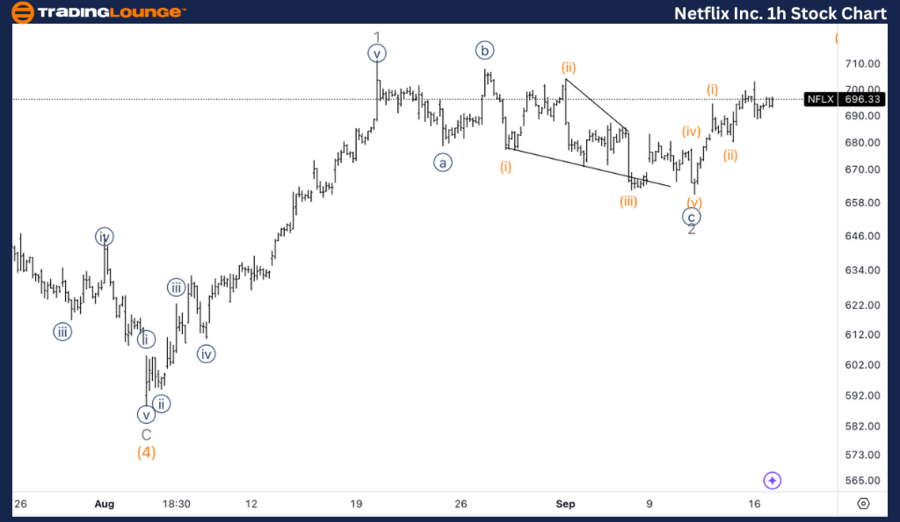
NFLX Elliott Wave Analysis Trading Lounge 1-Hour Chart

NFLX Elliott Wave Technical Analysis

Function: Trend

Mode: Impulsive

Structure: Motive

Position: Wave {i} of 3

Direction: Upside in Wave 3

Details: It seems that Wave 2 has bottomed, and we are resuming the upward trend. We could either be in Wave ii of (iii) or in Wave (iv) of {i}, potentially forming a leading diagonal pattern.

NFLX Elliott Wave Technical Analysis – 1-Hour Chart

In the 1-hour chart, the wave structure indicates that NFLX is likely in the early stages of a new impulsive phase. The stock is either completing a minor correction before moving higher or advancing within a larger impulsive wave. A continued rally in Wave {i} of 3 would confirm the bullish scenario, with short-term resistance levels providing potential breakout opportunities.

Technical Analyst: Alessio Barretta

Source: visit Tradinglounge.com and learn From the Experts Join TradingLounge Here 

See Previous:Meta Platforms Inc. (META) Elliott Wave Technical Analysis

Special Trial Offer - 0.76 Cents a Day for 3 Months! Click here

Access 7 Analysts Over 200 Markets Covered. Chat Room With Support

Netflix-Inc-1h-Stock...

Related

Vechain (VETUSD) Elliott Wave Insight: Wave II Retracement Setup, Swing Trade Entry Zones and Risk Strategy Detailed Analysis

Vechain (VETUSD) Elliott Wave Insight: Wave II Retracement Setup, Swing Trade Entry Zones and Risk Strategy Detailed Analysis

This Vechain (VETUSD) Elliott Wave report covers daily and 4-hour chart structures. Following Wave (...

Read More >
Mastering Bitcoin/ U.S. dollar(BTCUSD) Elliott Wave Technical Analysis for Profitable Trading

Mastering Bitcoin/ U.S. dollar(BTCUSD) Elliott Wave Technical Analysis for Profitable Trading

As of February 29, 2024, leverage the insights from TradingLounge's daily and 4-hour BTCUSD char...

Read More >
Expert Elliott Wave Analysis: S&P 500, NASDAQ 100, DAX 40, FTSE 100 & ASX 200 Trading Insights

Expert Elliott Wave Analysis: S&P 500, NASDAQ 100, DAX 40, FTSE 100 & ASX 200 Trading Insights

TradingLounge delivers advanced Elliott Wave analysis and actionable trading strategies for major in...

Read More >
WTI Crude Oil Elliott Wave Technical Analysis: Key Resistance and Support Levels, and Technical Insights for Market Trends

WTI Crude Oil Elliott Wave Technical Analysis: Key Resistance and Support Levels, and Technical Insights for Market Trends

WTI crude oil's Elliott Wave patterns, highlight a potential move toward $80 while remaining in ...

Read More >
U.S. Dollar/Canadian Dollar (USD/CAD) Elliott Wave Analysis Reveals Potential Trading Opportunities

U.S. Dollar/Canadian Dollar (USD/CAD) Elliott Wave Analysis Reveals Potential Trading Opportunities

Explore actionable insights into the U.S. Dollar/Canadian Dollar (USD/CAD) currency pair through com...

Read More >
Stay informed on BPCL’s Stock Performance and Trading Strategies: BPCL Stock Elliott Wave Technical Analysis

Stay informed on BPCL’s Stock Performance and Trading Strategies: BPCL Stock Elliott Wave Technical Analysis

Discover in-depth BPCL share price analysis through Elliott Wave technical analysis. This detailed f...

Read More >

$1 for 2 Weeks

then $29 a month!

What a Special Offer!

Trade Recommendations

Unleash the power of deversified trading with our comprehensive portfolio, covering 250+ markets:

  • Stock Trades
  • Crypto Trades
  • Forex Trades
  • Commodity Trades
Elliott Wave Analysis

Gain a competitive edge with expert insights and AI-powered Elliott Wave charting into:

  • Global Indices
  • US Stocks & ASX Stocks
  • Forex & Crypto
  • Commodities
Top-Notch Trading Tools

Equip yourself with the tools of success:

  • Real-time Chat rooms
  • Elliott Wave Algorithm
  • Portfolio tools
  • TradingLevels
  • Screener
  • Trading Game
7 Elliott Wave Analysts

Stay ahead of the market with daily charts and insightful videos
Your secret to strategic trading!

JOIN HERE


Welcome to TradingLounge (ASIC A.R.No. 321187), specialists in trades, trading education and technical analysis, covering stocks, indices, commodities, forex and cryptocurrencies.

When you join TradingLounge you have access to everything we offer, including trade tools, educational content and a social platform to chat with like-minded investors.

Read more

@Copyright 2024 by tradinglounge.com

Contact Us

Australian no: 02 4787 6020

International no: +61 (2) 47876020

Pay with:

Find us on