Explore the latest Elliott Wave analysis for Chevron (CVX) as of May 20, 2024. Discover key support and resistance levels and potential price targets for CVX stock.

Chevron Inc. (CVX) Elliott Wave Trading Lounge Analysis - Daily Chart

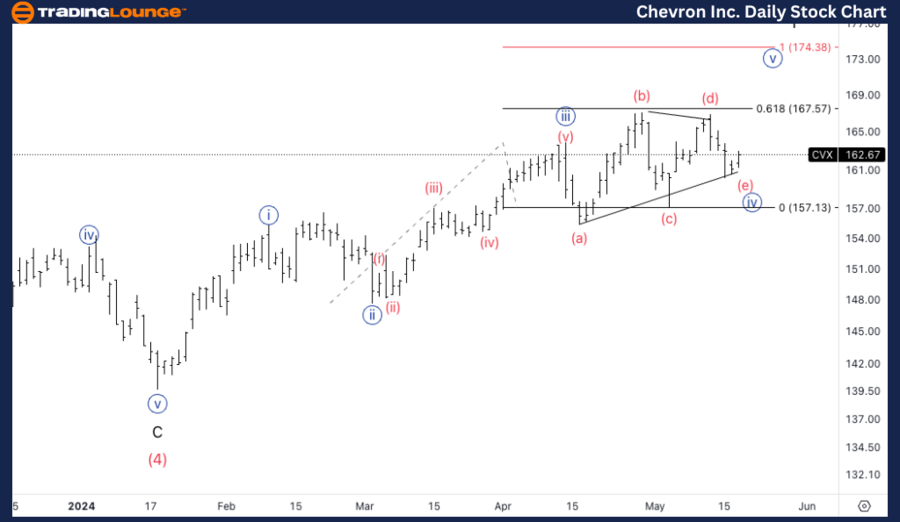
Chevron Inc., (CVX) Daily Chart Analysis

CVX Elliott Wave Technical Analysis

Function: Trend

Mode: Impulsive

Structure: Motive

Position: Minor wave 1

Direction: Upside in Minute {v}

Details: Chevron Inc. (CVX) shows an upward trend in the daily chart analysis. We are closely monitoring Minor wave 1 for a top. A breakthrough past the previous wave B top at $171 is critical. Achieving this level will confirm further bullish momentum.

Chevron (CVX) is currently in the final stages of Minor wave 1, with an expected top in Minute wave {v}. We are looking for a break above the previous wave B top at $171, which would provide additional confirmation of further upside potential.

Chevron-Inc-daily-st...


Trading Lounge Chevron Inc. (CVX) Elliott Wave Analysis - 4-Hour Chart

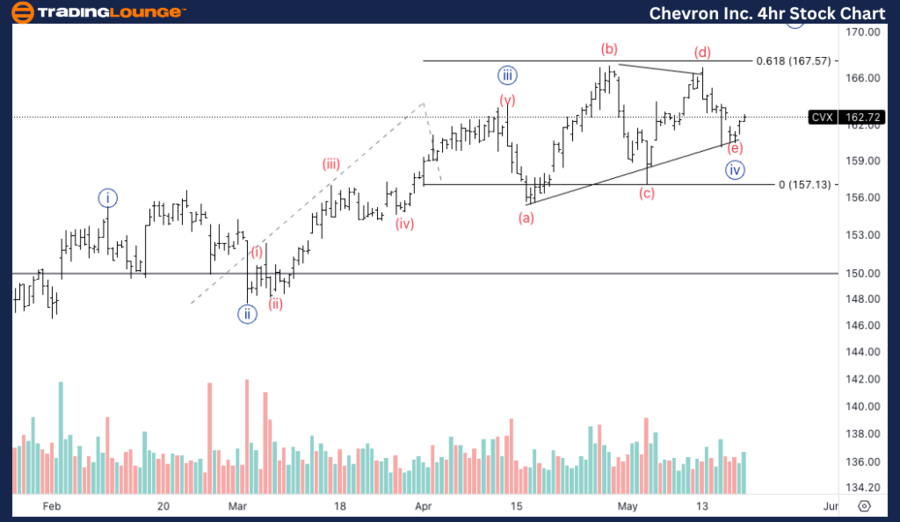
Chevron Inc.,  (CVX) 4Hr Chart Analysis

CVX In-Depth Technical Analysis

Function: Trend

Mode: Impulsive

Structure: Motive

Position: Wave (e) of {iv}

Direction: Upside in wave (i) of {v}

Details: On the 4-hour chart, we are observing a potential triangle formation in wave {iv}. We expect this pattern to be completed soon. Post-completion, an upside movement in wave (i) of {v} is anticipated, indicating a resumption of the bullish trend.

On the 4-hour chart, CVX appears to be completing a potential triangle formation in wave {iv}. Once this triangle is completed, we expect an upside resumption in wave (i) of {v}.

Technical Analyst: Malik Awais

Source: visit Tradinglounge.com and learn From the Experts Join TradingLounge Here 

See Previous: Texas Instruments Inc.(TXN) Stocks Elliott Wave Technical Analysis

Special Trial Offer - 0.76 Cents a Day for 3 Months! Click here

Access 7 Analysts Over 170 Markets Covered. Chat Room With Support

Chevron-Inc-4h-stock...


Conclusion

The Elliott Wave analysis for Chevron Inc. (CVX) indicates a strong potential for an upward trend. Investors should watch for key levels and patterns highlighted in the daily and 4-hour charts. This analysis provides critical insights to make well-informed investment decisions.

Related

Texas Instruments Inc. Stocks Analysis and Price Movements: TXN Elliott Wave Technical Analysis

Texas Instruments Inc. Stocks Analysis and Price Movements: TXN Elliott Wave Technical Analysis

Explore our in-depth Elliott Wave analysis of Texas Instruments Inc. (TXN). This analysis covers TXN...

Read More >
NIKKEI 225 Index Elliott Wave Technical Analysis - Focusing on N225 Trading Strategies, Market Trends, and Forecasts

NIKKEI 225 Index Elliott Wave Technical Analysis - Focusing on N225 Trading Strategies, Market Trends, and Forecasts

This article provides a comprehensive Elliott Wave analysis of the Nikkei 225 (N225), focusing on tr...

Read More >
Gold XAUUSD Commodity Elliott Wave Technical Analysis:Assessing the Current Trend and Structure

Gold XAUUSD Commodity Elliott Wave Technical Analysis:Assessing the Current Trend and Structure

Gold Elliott Wave Analysis, identifying the crucial stages of the current impulse wave sequence and ...

Read More >
Successful forex trading with expert insights: Australian Dollar/U.S.Dollar (AUDUSD) Elliott Wave Technical Analysis

Successful forex trading with expert insights: Australian Dollar/U.S.Dollar (AUDUSD) Elliott Wave Technical Analysis

Discover the latest AUDUSD Elliott Wave analysis for March 12, 2024, providing comprehensive insight...

Read More >
IBEX 35 (Spain) index Wave Technical Analysis: Bullish Trend, Impulsive Wave Count, Market Trends, and Trading Opportunities Explained

IBEX 35 (Spain) index Wave Technical Analysis: Bullish Trend, Impulsive Wave Count, Market Trends, and Trading Opportunities Explained

IBEX 35 Elliott Wave Analysis provides a detailed technical breakdown of the market trend, highlight...

Read More >
Elliott Wave Analysis: SP 500, NASDAQ, AAPL, AMZN, NVDA, META, NFLX, GOOGL, MSFT, TSLA, BITCOIN

Elliott Wave Analysis: SP 500, NASDAQ, AAPL, AMZN, NVDA, META, NFLX, GOOGL, MSFT, TSLA, BITCOIN

US Tech stock and indices are approaching Elliott Wave Primary 3) degree. Expect lower trading volum...

Read More >

Buy 1 Month

Get 3 Months!

Special Offer:

Trade Recommendations

Unleash the power of deversified trading with our comprehensive portfolio, covering:

  • Stock Trades
  • Crypto Trades
  • Forex Trades
  • Commodity Trades
Elliott Wave Analysis

Gain a competive edge with expert insights in to:

  • Global Indices
  • US Stocks & ASX Stocks
  • Forex & Crypto
  • Commodities
Top-Notch Trading Tools

Equip yourself with the tools of success:

  • Social Chat
  • Elliott Wave Algorithm
  • Screener
  • TradingLevels
  • Trading Game
7 Elliott Wave Analysts

Stay ahead of the market with daily charts and insightful videos
-Your secret to strategic trading!

JOIN HERE


Welcome to TradingLounge (ASIC A.R.No. 321187), specialists in trades, trading education and technical analysis, covering stocks, indices, commodities, forex and cryptocurrencies.

When you join TradingLounge you have access to everything we offer, including trade tools, educational content and a social platform to chat with like-minded investors.

Read more

@Copyright 2024 by tradinglounge.com

Contact Us

Australian no: 02 4787 6020

International no: +61 (2) 47876020

Pay with:

Find us on