17Feb

Cardano (ADAUSD) Elliott Wave Analysis: Resistance & Support Levels, Crypto Market Trends, and Technical Analysis

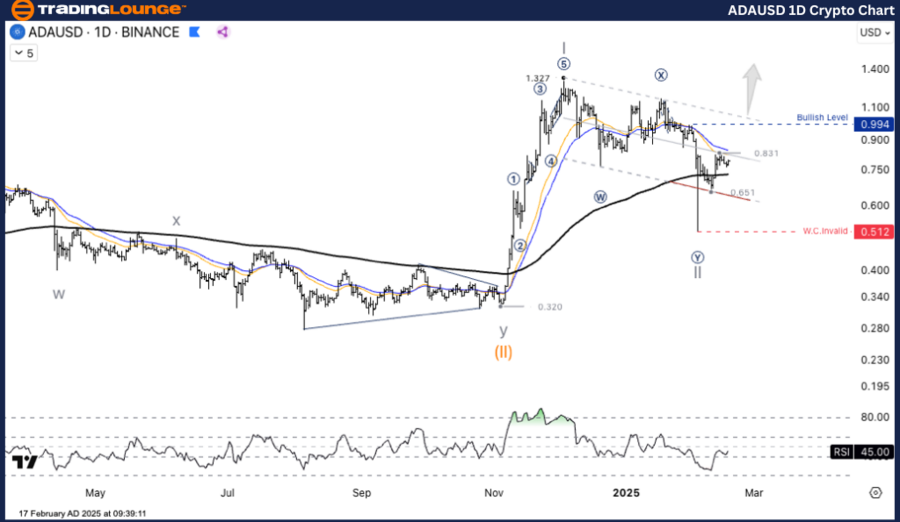
Cardano (ADAUSD) Elliott Wave Analysis – Daily Chart

ADA/USD Elliott Wave Technical Analysis

Function: Counter Trend

Mode: Corrective

Structure: Double Corrective

Position: Wave ((Y))

Next Higher Degree Direction: Uptrend Initiation

Wave Cancelation Invalid Level: Below 0.512 USD

Analysis: ADA/USDT has likely completed Wave II and is now entering Wave 1 of Wave III. The initial target projection stands at 1.327 USDT, marking the next potential bullish phase.

ADA/USD Trading Strategy

Current Trend: ADA is at the early stage of Wave 1 uptrend, following the completion of Wave II. The price established support at 0.512 USD, forming a WXY pattern. The ongoing wave structure indicates a bullish breakout in Wave 1 of III.

Trading Strategies

Long Strategy:

  • Enter long positions once the price breaks through the 0.831 resistance level, signaling a potential strong rally in Wave (3).

Risk Management:

  • If price drops below 0.512 USD, the wave count structure becomes invalid, indicating a potential shift in market direction.

adausd-1d-crypto-cha...


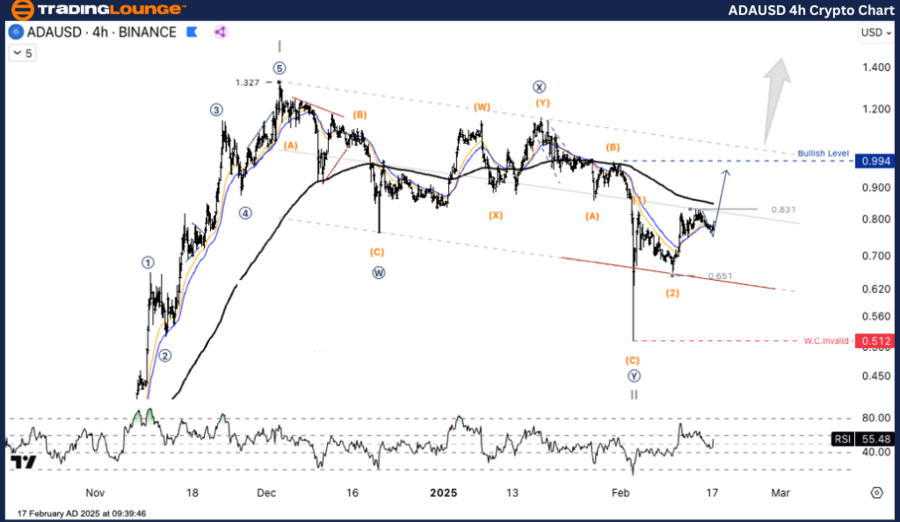
Cardano (ADAUSD) Elliott Wave Analysis –  H4 Chart

ADA/USD Elliott Wave Technical Analysis

Function: Counter Trend

Mode: Corrective

Structure: Double Corrective

Position: Wave ((Y))

Next Higher Degree Direction: Uptrend Initiation

Wave Cancelation Invalid Level: Below 0.512 USD

Analysis: ADA/USDT appears to have completed Wave II and is now transitioning into Wave 1 of Wave III. The projected first target remains at 1.327 USDT, reinforcing a bullish sentiment.

ADA/USD Trading Strategy

Current Trend: ADA is confirming the Wave 1 uptrend, having previously completed Wave II. The asset established a key support level at 0.512 USD, forming a WXY pattern. Current price action suggests a bullish continuation as Wave 1 of III takes shape.

Trading Strategies

Long Strategy:

  • Open long positions when the price surpasses the 0.831 resistance level, confirming further bullish momentum in Wave (3).

Risk Management:

  • If ADA drops below 0.512 USD, the current Elliott wave count is invalid, suggesting a potential market reversal.

Technical Analyst: Kittiampon Somboonsod

Source: visit Tradinglounge.com and learn From the Experts Join TradingLounge Here 

Previous: AAVEUSD Elliott Wave Technical Analysis

VALUE Offer - Buy 1 Month & Get 3 Months!Click here

Access 7 Analysts Over 200 Markets Covered. Chat Room With Support

adausd-4h-crypto-cha...​​​​​​​

Related

Theta Token (THETAUSD) Wave 4 Consolidation Near Fibonacci Support Points to Wave 5 Breakout Opportunity in Bullish Elliott Wave Setup

Theta Token (THETAUSD) Wave 4 Consolidation Near Fibonacci Support Points to Wave 5 Breakout Opportunity in Bullish Elliott Wave Setup

Theta Token (THETAUSD) is consolidating in wave 4 within a bullish Elliott Wave structure. A breakou...

Read More >
Understand Price Movements and Forecast Trends: Cardano Crypto Price News Today Elliott Wave Technical Analysis

Understand Price Movements and Forecast Trends: Cardano Crypto Price News Today Elliott Wave Technical Analysis

Discover in-depth Elliott Wave analysis for Cardano (ADAUSD) to understand price movements and forec...

Read More >
IBEX 35 (Spain) Index Elliott Wave Technical Analysis: Reveals key insights into the current market trends

IBEX 35 (Spain) Index Elliott Wave Technical Analysis: Reveals key insights into the current market trends

The IBEX 35's Elliott Wave analysis reveals key insights into the current market trends. On the ...

Read More >
Elliott Wave Analysis: Major Indices Poised for Potential Upswings Amid Key Economic Data Releases

Elliott Wave Analysis: Major Indices Poised for Potential Upswings Amid Key Economic Data Releases

S&P 500 (SPX): The Wave ii) low may be established, but confirmation is needed through a completed u...

Read More >
QCOM Elliott Wave Signals Impulse Rally Ahead as QUALCOMM Targets Breakout Above $150 Resistance in Bullish Wave Setup

QCOM Elliott Wave Signals Impulse Rally Ahead as QUALCOMM Targets Breakout Above $150 Resistance in Bullish Wave Setup

QUALCOMM (QCOM) is showing signs of a bullish reversal near $150. Elliott Wave analysis suggests an ...

Read More >
Elliott Wave Analysis: Bearish and Bullish Scenarios for SP 500 and Nasdaq 100

Elliott Wave Analysis: Bearish and Bullish Scenarios for SP 500 and Nasdaq 100

The Elliott Wave analysis of the SP 500 and Nasdaq 100 indices suggests a predominant bearish trend ...

Read More >

Buy 1 Month

Get 3 Months!

Special Offer:

Trade Recommendations

Unleash the power of deversified trading with our comprehensive portfolio, covering:

  • Stock Trades
  • Crypto Trades
  • Forex Trades
  • Commodity Trades
Elliott Wave Analysis

Gain a competive edge with expert insights in to:

  • Global Indices
  • US Stocks & ASX Stocks
  • Forex & Crypto
  • Commodities
Top-Notch Trading Tools

Equip yourself with the tools of success:

  • Social Chat
  • Elliott Wave Algorithm
  • Screener
  • TradingLevels
  • Trading Game
7 Elliott Wave Analysts

Stay ahead of the market with daily charts and insightful videos
-Your secret to strategic trading!

JOIN HERE


Welcome to TradingLounge (ASIC A.R.No. 321187), specialists in trades, trading education and technical analysis, covering stocks, indices, commodities, forex and cryptocurrencies.

When you join TradingLounge you have access to everything we offer, including trade tools, educational content and a social platform to chat with like-minded investors.

Read more

@Copyright 2024 by tradinglounge.com

Contact Us

Australian no: 02 4787 6020

International no: +61 (2) 47876020

Pay with:

Find us on