DAX (Germany) Elliott Wave Analysis | TradingLounge Day Chart
DAX (Germany) Day Chart Analysis
DAX (Germany) Wave Technical Analysis
Technical Overview
Function: Bullish Trend
Mode: Impulsive
Structure: Orange Wave 1
Position: Navy Blue Wave 3
Direction Next Lower Degrees: Orange Wave 2
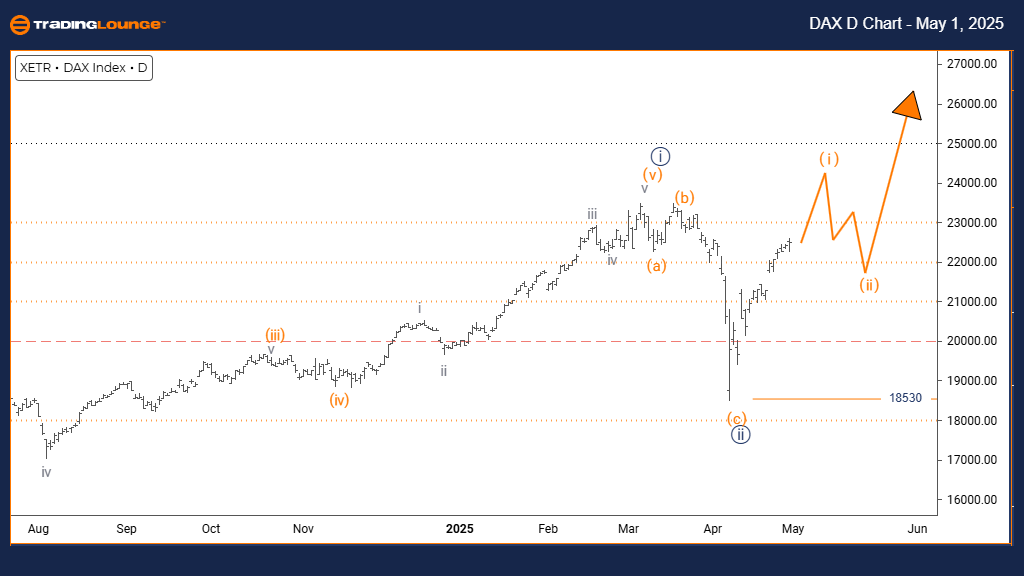
Details: Navy Blue Wave 2 is completed, and Orange Wave 1 of 3 is currently developing.
Cancel Invalidation Level: 18530
Elliott Wave Analysis for DAX (Germany) Daily Chart:
The DAX 40 Index (Germany) daily chart signals a bullish Elliott Wave setup within an impulsive structure. After completing the navy blue wave 2 correction, the index is advancing into orange wave 1, inside the broader navy blue wave 3. This movement indicates the early phase of a larger bullish cycle, with expectations of building upward momentum.
Orange wave 1 typically initiates a new impulsive sequence, often characterized by a steady increase in price action. The conclusion of navy blue wave 2 creates a strong foundation for higher prices, likely progressing in measured steps before more aggressive bullish momentum develops during wave 3.
Next Movement Expectations
Key support remains at 18530, acting as the invalidation level for the bullish wave count. A decline below this level would negate the current Elliott Wave structure and require reevaluation. Protecting the wave 2 low is essential for sustaining the bullish scenario.
In the daily timeframe, the emergence of an impulsive wave structure offers new long-trade setups. Traders should observe gradual volume expansion and consistent upward price action — hallmarks of an unfolding wave 1. Typically, wave 1 sets the stage without the explosive moves associated with wave 3.
Following the completion of orange wave 1, a corrective pullback in orange wave 2 is expected, providing an opportunity to enter at lower levels before a strong rally in wave 3. Monitoring momentum indicators and price structure will be critical for confirming the transition between waves.
With navy blue wave 3 underway at the larger degree, strategic bullish positioning now could benefit from stronger rally phases, making this a crucial area for active Elliott Wave trading setups.
DAX (Germany) Elliott Wave Analysis | TradingLounge Weekly Chart
DAX (Germany) Wave Technical Analysis
Technical Overview
Function: Bullish Trend
Mode: Impulsive
Structure: Navy Blue Wave 3
Position: Gray Wave 3
Direction Next Higher Degrees: Navy Blue Wave 3 (In Progress)
Details: Navy Blue Wave 2 is completed, with Navy Blue Wave 3 of 3 now active.
Cancel Invalidation Level: 18530
Elliott Wave Analysis for DAX (Germany) Weekly Chart:
The DAX 40 Index (Germany) weekly Elliott Wave chart highlights a strong bullish trend developing within an impulsive wave structure. After completing the corrective navy blue wave 2, the market has entered navy blue wave 3 inside the larger gray wave 3 structure. This phase typically represents the most powerful part of a bullish trend.
Navy blue wave 3, according to Elliott Wave theory, is usually the most dynamic movement, offering extended rallies and sustained upward momentum. The ending of wave 2 correction has cleared the path for a more forceful advance, often surpassing the range of wave 1 in both size and strength.
Next Movement Expectations
On the weekly timeframe, the analysis points to a significant bullish phase as part of a larger uptrend. A critical invalidation level to watch remains at 18530 — a break below would require a fresh wave assessment.
As navy blue wave 3 progresses, traders should track classic Elliott Wave signals such as surging volume, expanding price swings, and strong momentum. Maintaining long positions is favored while carefully monitoring for any signs of wave 3 maturity.
Upon the completion of navy blue wave 3, the market is expected to enter a corrective navy blue wave 4 phase, providing another buying opportunity before the next bullish push. This portion of the Elliott Wave sequence generally offers some of the best trading conditions, making it essential for traders to stay engaged with the evolving wave structure.
Technical Analyst: Malik Awais
Source: Visit Tradinglounge.com and learn from the Experts. Join TradingLounge Here
Previous: S&P BSE SENSEX NEXT 50 Elliott Wave Technical Analysis
VALUE Offer - Buy 1 Month & Get 3 Months!Click here
Access 7 Analysts Over 200 Markets Covered. Chat Room With Support
