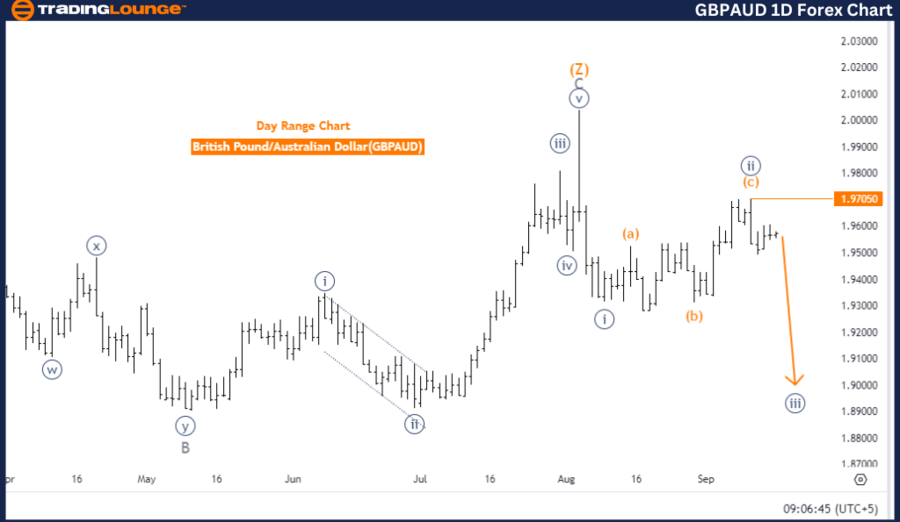
British Pound/Australian Dollar (GBPAUD) Day Chart Analysis
GBPAUD Elliott Wave Technical Analysis
Trend: Bearish
Mode: Impulsive
Structure: Navy Blue Wave 3
Next Lower Degree: Navy Blue Wave 3 (in progress)
Analysis Summary: The GBPAUD Elliott Wave analysis for the daily chart shows a strong bearish trend, with the market currently in an impulsive mode. The structure being analyzed is Navy Blue Wave 3, following the completion of Navy Blue Wave 2, indicating the continuation of the downward movement.
Completion of Navy Blue Wave 2:
The corrective phase of Navy Blue Wave 2 has ended, and the market is now in Navy Blue Wave 3. Typically, this wave represents an aggressive move in the direction of the trend, which is bearish in this case.
Navy Blue Wave 3 Characteristics:
In Elliott Wave theory, Wave 3 is known for its strong momentum and extended price declines. As Navy Blue Wave 3 has just begun, the British Pound is expected to weaken further against the Australian Dollar. This phase is likely to accelerate, reflecting increased bearish pressure in the market.
Wave Cancel Invalidation Level:
The invalidation level is at 970.50. If the price rises above this level, the current bearish wave count will be invalidated, requiring a reassessment of the trend. As long as the price stays below this level, the market is expected to remain bearish, with Navy Blue Wave 3 driving prices lower.
Key Takeaways:
- Trend: Bearish
- Structure in Play: Navy Blue Wave 3
- Invalidation Level: 970.50 (price above this level cancels the current bearish wave count)
- Market Expectation: Continued downward movement unless the price exceeds the invalidation level.
In conclusion, the GBPAUD daily chart indicates a bearish trend, with Navy Blue Wave 3 in progress. The trend will continue unless the price surpasses the invalidation level of 970.50.
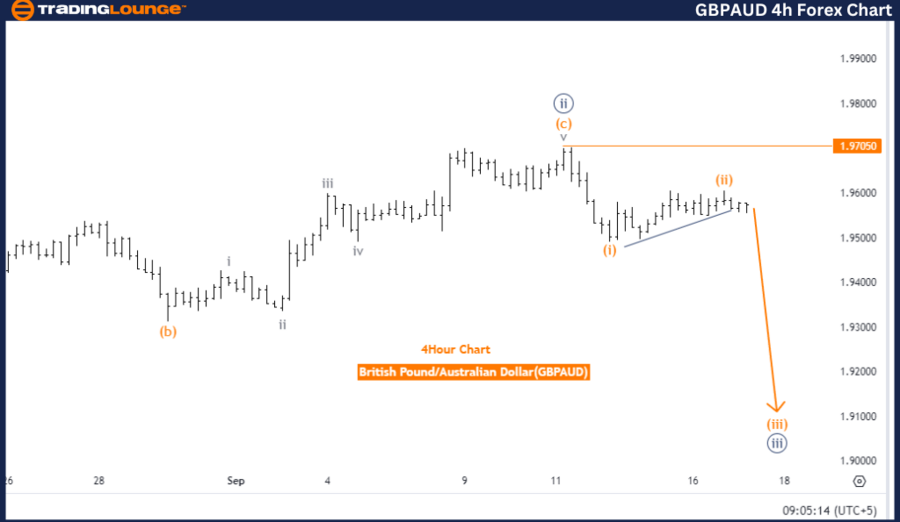
British Pound/Australian Dollar (GBPAUD) 4-Hour Chart Analysis
Elliott Wave Technical Analysis for GBPAUD:
- Trend: Bearish
- Mode: Impulsive
- Structure: Orange Wave 3
- Position: Navy Blue Wave 3
- Next Lower Degree: Orange Wave 3 (in progress)
Analysis Summary:
The 4-hour chart analysis of GBPAUD reflects a bearish trend in an impulsive phase. The structure being observed is Orange Wave 3, which began after the conclusion of Orange Wave 2. This suggests that the corrective phase has ended, and the market is moving downward in the impulsive phase of Orange Wave 3.
Orange Wave 3 Characteristics:
Orange Wave 3 signifies a strong move in the bearish direction. In Elliott Wave terms, Wave 3 typically presents the most extended and forceful movement, indicating further weakening of the British Pound against the Australian Dollar.
Navy Blue Wave 3 Support:
This wave is part of a larger structure, with Navy Blue Wave 3 also progressing. The alignment between Orange Wave 3 and Navy Blue Wave 3 enhances the bearish outlook, implying more downside pressure for the GBPAUD pair.
Wave Cancel Invalidation Level:
The invalidation level is set at 970.50. If the price climbs above this point, the current bearish wave structure will be invalidated, signaling a potential trend reversal. However, if the price remains below this level, the downward trend of Orange Wave 3 is expected to persist.
Key Takeaways:
- Trend: Bearish
- Structure in Play: Orange Wave 3
- Invalidation Level: 970.50 (above this level cancels the current wave count)
- Market Expectation: Continued downward movement unless the price breaks the invalidation level.
In conclusion, the 4-hour GBPAUD chart continues to show a bearish trend, with Orange Wave 3 in progress. The market is expected to move downward unless the price breaks above the invalidation level of 970.50.
Technical Analyst: Malik Awais
Source: visit Tradinglounge.com and learn From the Experts Join TradingLounge Here
Previous: USDCAD Elliott Wave Technical Analysis
Special Trial Offer - 0.76 Cents a Day for 3 Months! Click here
Access 7 Analysts Over 200 Markets Covered. Chat Room With Support