06Jan

Adani Enterprises Elliott Wave Analysis: Technical Insights, Price Predictions, and Chart Analysis for Informed Trading Decisions

ADANI ENTERPRISES LTD – ADANIENT (1D Chart) Elliott Wave Technical Analysis

ADANIENT Elliott Wave Technical Analysis

Function: Counter Trend (Minor degree, Grey)

Mode: Corrective

Structure: Flat (3-3-5)

Position: Minute Wave ((iii)) Navy

Details:

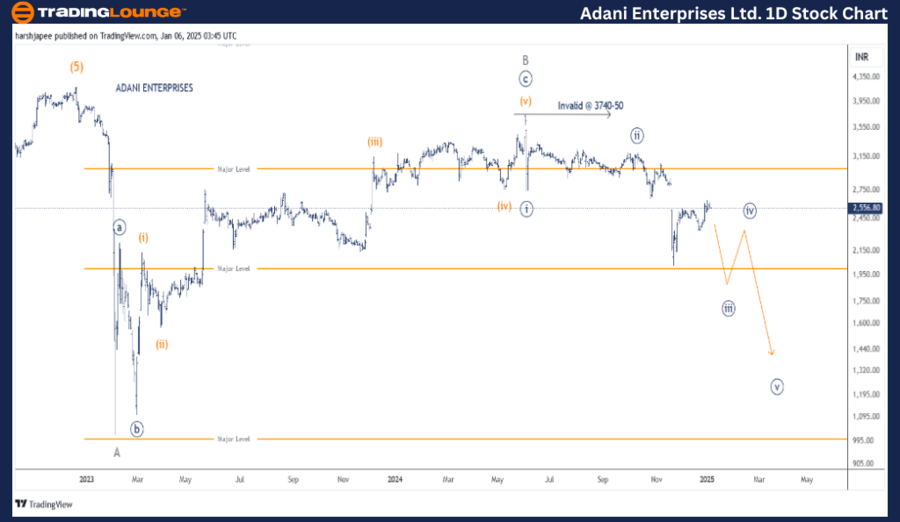
  • Minute Waves ((i)) and ((ii)) Navy of Wave C Grey are complete, with Wave ((iii)) currently in progress.
  • Price action suggests prices should ideally remain below the 3200 mark.
  • Invalidation Point: 3750

ADANI ENTERPRISES Daily Chart Technical Analysis and Potential Elliott Wave Counts

The daily chart of ADANI ENTERPRISES indicates a potential trend reversal after the stock hit the 4170–4180 range in December 2022. Intermediate Wave (5) Orange appears to have completed, marking the initiation of a Minor degree corrective wave sequence, A-B-C.

Key insights:

  • Minor Wave A concluded near the 1020 level in February 2023.
  • This was followed by a corrective rally consisting of Minute ((a))-((b))-((c)), marking the end of Minor Wave B Grey around the 3740–3750 range.
  • Following this, bearish momentum has dominated, signaling the development of Minor Wave C lower.

ADANI-ENTERPRISES-LT...


ADANI ENTERPRISES LTD – ADANIENT (4H Chart) Elliott Wave Technical Analysis

Function: Counter Trend (Minor degree, Grey)

Mode: Corrective

Structure: Flat (3-3-5)

Position: Minute Wave ((iii)) Navy

Details:

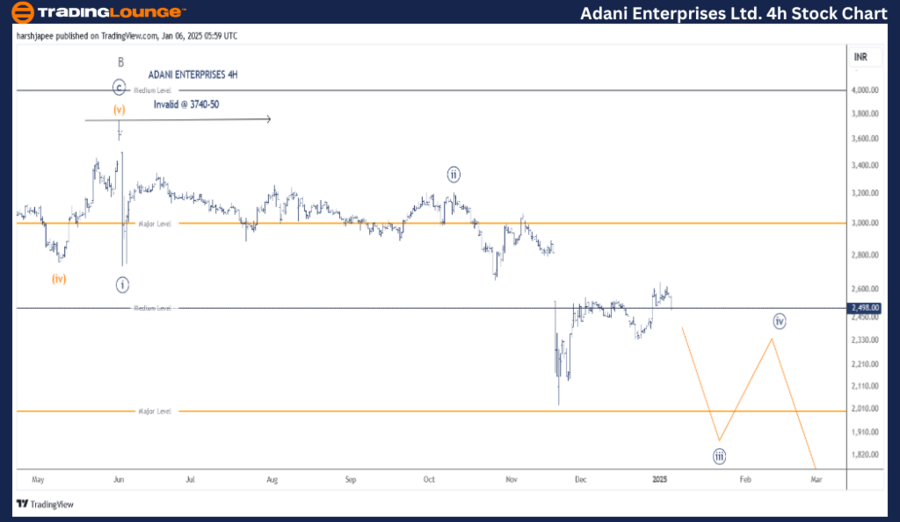
  • Sub-waves ((i)) and ((ii)) Navy of Wave C Grey have been established, with Wave ((iii)) currently unfolding.
  • It is likely that Minute Wave ((iii)) is extending downward.
  • Price Outlook: Ideally, prices should remain below the 3200 mark.
  • Invalidation Point: 3750

ADANI ENTERPRISES 4H Chart Technical Analysis and Potential Elliott Wave Counts

The 4H chart provides detailed insights into the sub-waves following the conclusion of Minor Wave B near the 3740–3750 range. Wave C appears to be developing as an impulse, a typical pattern for this structure.

Key observations:

  • Minute Waves ((i)) and ((ii)) completed near the 2754 and 3214 levels, respectively.
  • Minute Wave ((iii)) now seems to be extending, with a potential target near 1650.
  • The bearish projection remains valid as long as prices stay below 3200.

Technical Analyst: Harsh Japee

Source: visit Tradinglounge.com and learn From the Experts Join TradingLounge Here 

Previous: NESTLE INDIA Elliott Wave Technical Analysis

VALUE Offer - Buy 1 Month & Get 3 Months!Click here

Access 7 Analysts Over 200 Markets Covered. Chat Room With Support

ADANI-ENTERPRISES-LT...


Conclusion

ADANI ENTERPRISES is trending lower, currently within Minute Wave ((iii)) of Minor Wave C, targeting the 1650 mark. Investors should monitor key levels for potential invalidation or confirmation of the ongoing corrective structure.

Related

Stock Market Elliott Wave Analysis: Trading Strategies for S&P 500, NASDAQ 100, and Top Tech Stocks

Stock Market Elliott Wave Analysis: Trading Strategies for S&P 500, NASDAQ 100, and Top Tech Stocks

This analysis focuses on Elliott Wave technical patterns and trading strategies for major stock indi...

Read More >
Euro/U.S.Dollar(EURUSD) 4 Hour Chart Elliott Wave Technical Analysis 10 January 24

Euro/U.S.Dollar(EURUSD) 4 Hour Chart Elliott Wave Technical Analysis 10 January 24

EURUSD Elliott Wave Analysis dated 10 January 24, provides a comprehensive examination of the Euro/U...

Read More >
Critical invalidation levels are set: Bovespa Index Elliott Wave Technical Analysis provides detailed insights

Critical invalidation levels are set: Bovespa Index Elliott Wave Technical Analysis provides detailed insights

The Bovespa Index Elliott Wave analysis provides detailed insights into the current market trends us...

Read More >
Elliott Wave Forecast for NEWS CORPORATION (ASX:NWS) – Corrective Wave Insights, Price Targets, and Trading Strategy for March 2025

Elliott Wave Forecast for NEWS CORPORATION (ASX:NWS) – Corrective Wave Insights, Price Targets, and Trading Strategy for March 2025

NEWS CORPORATION (ASX:NWS), highlighting the current corrective phase and projecting future impulse ...

Read More >
Elliott Wave Analysis: US, Euro, and Asian Indices Poised for Growth

Elliott Wave Analysis: US, Euro, and Asian Indices Poised for Growth

### Summary The S&P 500, SPY, NASDAQ 100, and QQQ indices are moving towards higher levels as pre...

Read More >
GDX Elliott Wave Forecast Reveals VanEck Gold Miners ETF in Early Rally with Price Target Near $49 and Trading Opportunity

GDX Elliott Wave Forecast Reveals VanEck Gold Miners ETF in Early Rally with Price Target Near $49 and Trading Opportunity

This Elliott Wave analysis of the VanEck Gold Miners ETF (GDX) reveals a developing uptrend with bul...

Read More >

Buy 1 Month

Get 3 Months!

Special Offer:

Trade Recommendations

Unleash the power of deversified trading with our comprehensive portfolio, covering:

  • Stock Trades
  • Crypto Trades
  • Forex Trades
  • Commodity Trades
Elliott Wave Analysis

Gain a competive edge with expert insights in to:

  • Global Indices
  • US Stocks & ASX Stocks
  • Forex & Crypto
  • Commodities
Top-Notch Trading Tools

Equip yourself with the tools of success:

  • Social Chat
  • Elliott Wave Algorithm
  • Screener
  • TradingLevels
  • Trading Game
7 Elliott Wave Analysts

Stay ahead of the market with daily charts and insightful videos
-Your secret to strategic trading!

JOIN HERE


Welcome to TradingLounge (ASIC A.R.No. 321187), specialists in trades, trading education and technical analysis, covering stocks, indices, commodities, forex and cryptocurrencies.

When you join TradingLounge you have access to everything we offer, including trade tools, educational content and a social platform to chat with like-minded investors.

Read more

@Copyright 2024 by tradinglounge.com

Contact Us

Australian no: 02 4787 6020

International no: +61 (2) 47876020

Pay with:

Find us on