19Dec

Nestle India Stock Analysis with Elliott Wave Technical Patterns, Corrective Waves, Resistance Levels, and Chart Insights

NESTLE INDIA Elliott Wave Analysis - TradingLounge (1D Chart)

NESTLEIND Elliott Wave Technical Analysis

Function: Counter Trend (Minute Degree, Navy)

Mode: Corrective

Structure: Potential impulse within larger degree corrective wave

Position: Minute Wave ((i)) Navy

Details:

  • Minute Wave ((ii)) is advancing towards the 2500 levels, indicating a temporary upward movement before the prices potentially reverse lower.
  • Alternatively, the structure might represent an expanded flat, signaling the termination of Minor Wave 4 within the broader degree uptrend.

Invalidation Point: 2785

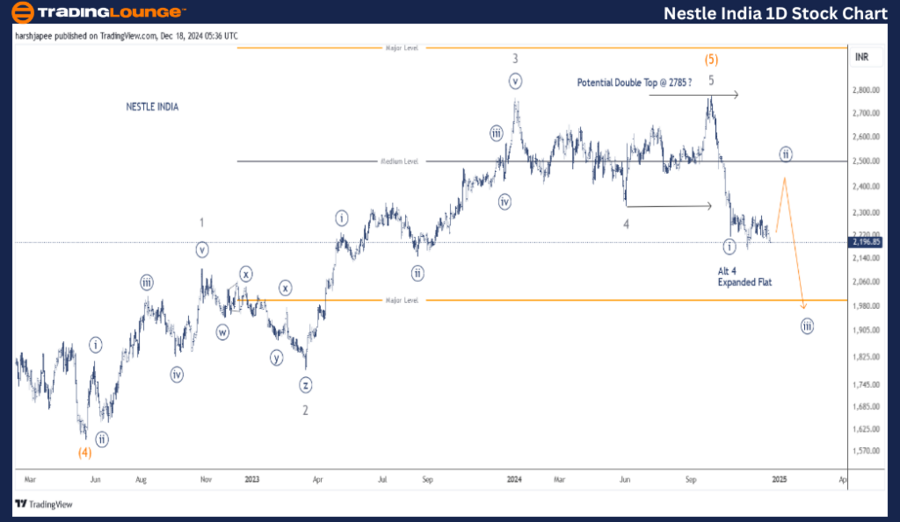
NESTLE INDIA Daily Chart Technical Analysis and Elliott Wave Counts:

The daily chart for NESTLE INDIA highlights the likelihood of a double top near 2785, as the stock experienced a significant reversal near 2185. This movement could either represent:

  • An initial impulsive decline marking the onset of a larger corrective wave.
  • Or, part of an expanded flat, concluding Minor Wave 4.

Regardless of the scenario, the price action suggests a rally to 2450, signaling the conclusion of Minute Wave ((ii)) before another downward move. The 2785 resistance remains pivotal, allowing bears to maintain control.

NESTLE-India-1D-Stoc...


NESTLE INDIA – NESTLEIND Elliott Wave Technical Analysis (4H Chart)

TradingLounge NESTLEIND (4H Chart) Technical Analysis

Function: Counter Trend (Minute Degree, Navy)

Mode: Corrective

Structure: Potential impulse within larger degree corrective wave

Position: Minute Wave ((i)) Navy

Details:

  • Minute Wave ((ii)) appears to be progressing towards 2500 levels, hinting at a corrective upward movement before the anticipated downward continuation.
  • Alternatively, this movement could represent an expanded flat that terminates Minor Wave 4 within the broader degree uptrend.

Invalidation Point: 2785

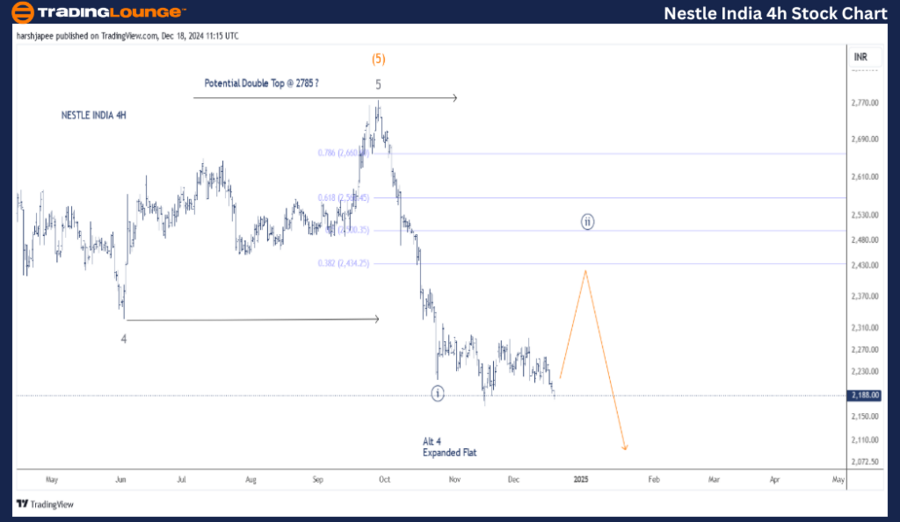
NESTLE INDIA 4H Chart Technical Analysis and Elliott Wave Counts:

The 4H chart reveals sub-waves following the termination of Minor Wave 4 around 2325.

  • Wave 5’s rally lacks a clear subdivision as an impulse, but the high-probability wave count suggests termination near 2782, indicating a potential double top.
  • The subsequent decline through 2215 appears impulsive and is labeled as Minute Wave ((i)).
  • Currently, an expanded flat Wave ((ii)) seems to be forming within the 2440-2450 zone before the prices resume their downward trend.
  • Alternatively, the entire decline from 2785 could represent a corrective expanded flat concluding Minor Wave 4 (Grey) around 2185.

Technical Analyst: Harsh Japee

Source: visit Tradinglounge.com and learn From the Experts Join TradingLounge Here 

Previous: TATA STEEL Elliott Wave Technical Analysis

VALUE Offer - Buy 1 Month & Get 3 Months!Click here

Access 7 Analysts Over 200 Markets Covered. Chat Room With Support

NESTLE-India-4h-Stoc...


Conclusion:

NESTLE INDIA is advancing within Minute Wave ((ii)), targeting the 2440-2450 zone, and remains within the framework of a larger downward impulsive wave. The 2785 resistance is crucial for maintaining bearish momentum.

Related

Cocoa Elliott Wave Analysis: Forecasting Price Correction, Bullish Trend, and Trading Strategies for Cocoa Futures and Investments

Cocoa Elliott Wave Analysis: Forecasting Price Correction, Bullish Trend, and Trading Strategies for Cocoa Futures and Investments

Cocoa prices are correcting after a record high, with a bullish long-term trend expected. Get a full...

Read More >
CIPLA Stock Analysis: Elliott Wave Forecast Reveals Corrective Wave Opportunities, Share Price Targets, and Key Trading Strategies

CIPLA Stock Analysis: Elliott Wave Forecast Reveals Corrective Wave Opportunities, Share Price Targets, and Key Trading Strategies

CIPLA’s stock trend using Elliott Wave Theory. Explore corrective wave structures, forecasted share...

Read More >
Bharat Electronics Stocks technical insights, price targets, and potential trend movements: BEL Elliott Wave Technical Analysis

Bharat Electronics Stocks technical insights, price targets, and potential trend movements: BEL Elliott Wave Technical Analysis

This analysis offers an in-depth look at Bharat Electronics (BEL) stock using Elliott Wave theory, c...

Read More >
British Pound/U.S.Dollar (GBPUSD) Elliott Wave Technical Analysis 19 October 23

British Pound/U.S.Dollar (GBPUSD) Elliott Wave Technical Analysis 19 October 23

In summary, the GBPUSD Elliott Wave Analysis for 19 October 23, delivers valuable insights into the ...

Read More >
Wheat Price Forecast 2025: Wheat Commodity Elliott Wave Signals End of Bearish Cycle with Support Near $500 for Trend Reversal

Wheat Price Forecast 2025: Wheat Commodity Elliott Wave Signals End of Bearish Cycle with Support Near $500 for Trend Reversal

Wheat futures remain bearish, but Elliott Wave analysis signals a potential reversal near $500 as an...

Read More >
Commodities & Futures Market Analysis: Elliott Wave Insights & Strategies

Commodities & Futures Market Analysis: Elliott Wave Insights & Strategies

The Commodities Market Trading Report provides a technical analysis using Elliott Wave, trading leve...

Read More >

$1 for 2 Weeks

then $29 a month!

What a Special Offer!

Trade Recommendations

Unleash the power of deversified trading with our comprehensive portfolio, covering 250+ markets:

  • Stock Trades
  • Crypto Trades
  • Forex Trades
  • Commodity Trades
Elliott Wave Analysis

Gain a competitive edge with expert insights and AI-powered Elliott Wave charting into:

  • Global Indices
  • US Stocks & ASX Stocks
  • Forex & Crypto
  • Commodities
Top-Notch Trading Tools

Equip yourself with the tools of success:

  • Real-time Chat rooms
  • Elliott Wave Algorithm
  • Portfolio tools
  • TradingLevels
  • Screener
  • Trading Game
7 Elliott Wave Analysts

Stay ahead of the market with daily charts and insightful videos
Your secret to strategic trading!

JOIN HERE


Welcome to TradingLounge (ASIC A.R.No. 321187), specialists in trades, trading education and technical analysis, covering stocks, indices, commodities, forex and cryptocurrencies.

When you join TradingLounge you have access to everything we offer, including trade tools, educational content and a social platform to chat with like-minded investors.

Read more

@Copyright 2024 by tradinglounge.com

Contact Us

Australian no: 02 4787 6020

International no: +61 (2) 47876020

Pay with:

Find us on