03Apr

GDX Elliott Wave Forecast Reveals VanEck Gold Miners ETF in Early Rally with Price Target Near $49 and Trading Opportunity

Greetings!

Since launching our US ETF sector coverage on March 11, we’ve paid close attention to the VanEck Gold Miners ETF (GDX) due to the promising setups the Elliott Wave Principle indicates. This blog is part of a series of GDX forecasts featuring detailed technical analysis and trading insights.

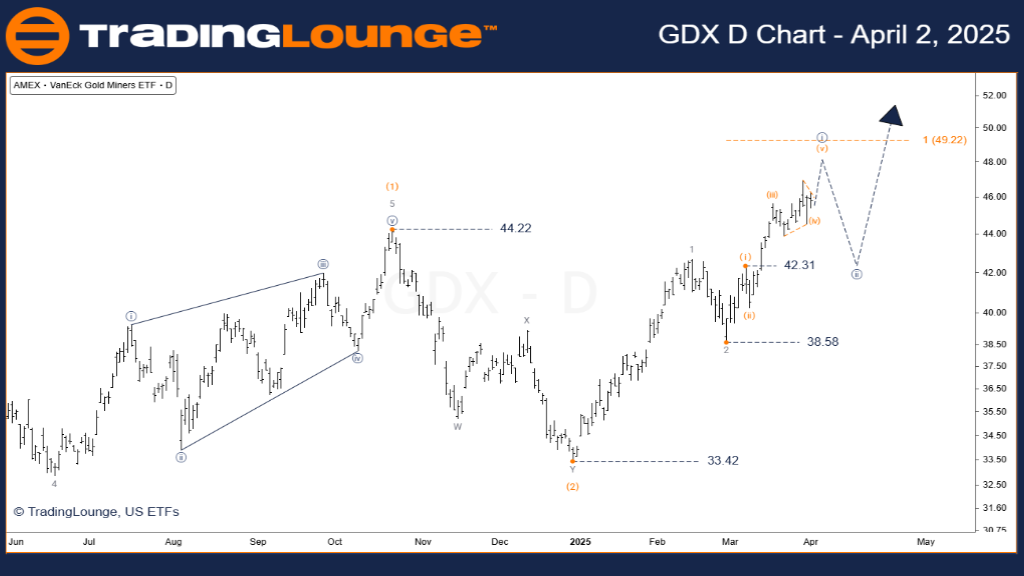
VanEck Gold Miners ETF – GDX Elliott Wave Analysis (1D) Chart

VanEck Gold Miners ETF – GDX  Daily Chart Analysis

GDX Elliott Wave Technical Analysis

Function: Major trend

Mode: Motive

Structure: Impulse

Position: Wave [i] navy

Direction: Rally

Details: Wave 3 is still in its early phase. With the current rally only reaching the 61.8% Fibonacci wave extension, this implies further bullish potential for GDX.

  • Subwave 1 of 3 is yet to complete, followed by a corrective subwave 2, which is expected to hold above the key support level at $38.59.
  • The Wave 1 peak is anticipated to serve as strong support for the expected correction, paving the way for Wave [iii] of 3 to the upside.

Invalidation level: $38.58

VanEck-Gold-Miners-E...


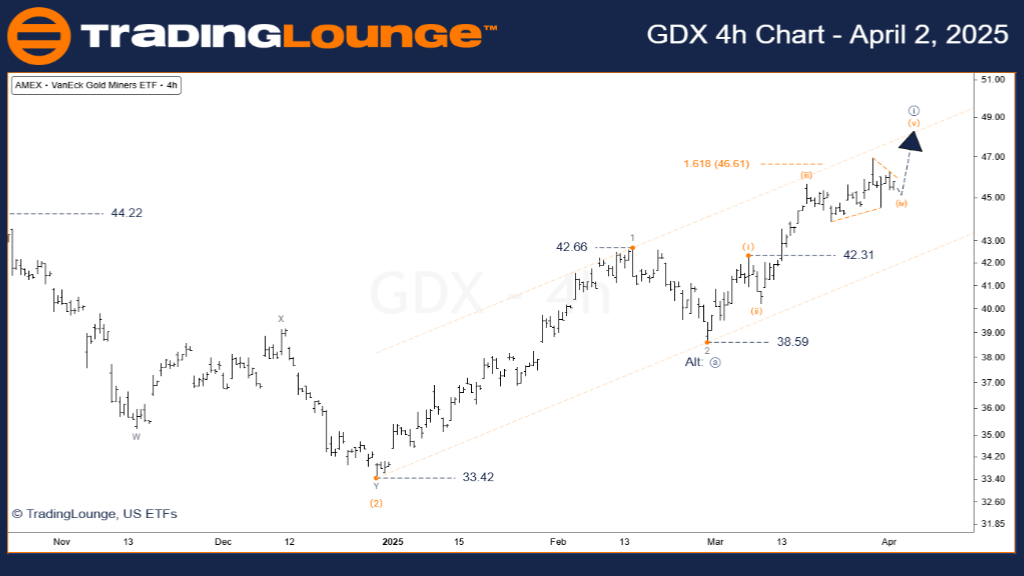
VanEck Gold Miners ETF – GDX Elliott Wave Analysis (4H)

VanEck Gold Miners ETF – GDX 4-Hourly Chart

Function: Major trend (Minor degree, grey)

Mode: Motive

Structure: Impulse

Position: Wave (iv) orange

Direction: Rally

Details:

  • Wave (iv) of [i] is evolving as a contracting triangle. A small dip may complete the triangle before the post-triangle thrust begins.
  • The 5th wave of [i] is expected to drive prices higher toward the $49.00 target, marking the end of wave [i] before wave [ii] commences.

Invalidation level: $44.50

Technical Analyst: Siinom

Source: Visit Tradinglounge.com and learn from the Experts. Join TradingLounge Here 

See Previous: XLE – SPDR Energy Select Sector ETF Elliott Wave Technical Analysis

VALUE Offer - Buy 1 Month & Get 3 Months!Click here

Access 7 Analysts Over 200 Markets Covered. Chat Room With Support

VanEck-Gold-Miners-E...


Conclusion:

Here’s the summary of the Elliott Wave analysis for GDX:

  • GDX remains in an early-stage uptrend.
  • The upcoming post-triangle breakout presents a strong short-term buying opportunity.
  • $49.00 remains the key price level for the termination of wave [i].
  • A corrective wave [ii] dip could offer an ideal entry point for long positions.
  • Following Elliott Wave guidelines and respecting invalidation levels is essential for risk management and consistent trading success.

Related

Costco Wholesale Corp.(COST:NASDAQ) Elliott Wave Technical Analysis 14 November 23

Costco Wholesale Corp.(COST:NASDAQ) Elliott Wave Technical Analysis 14 November 23

Costco Wholesale Corp.(COST:NASDAQ) Elliott Wave Technical Analysis on 14 November 23 with 1-Hour an...

Read More >
ASX:NEM - Newmont Corporation Elliott Wave Analysis, Trading Strategies & ASX Market Trends for Long-Term Investors

ASX:NEM - Newmont Corporation Elliott Wave Analysis, Trading Strategies & ASX Market Trends for Long-Term Investors

Newmont Corporation (ASX: NEM) forecast that highlights critical wave structures, key price levels, ...

Read More >
 Insightful Trading Strategies Unveiled: U.S.Dollar/Japanese Yen (USDJPY) Elliott Wave Technical Analysis

Insightful Trading Strategies Unveiled: U.S.Dollar/Japanese Yen (USDJPY) Elliott Wave Technical Analysis

The intricacies of USDJPY Elliott Wave Analysis through our comprehensive insights tailored for trad...

Read More >
VanEck Gold Miners ETF – GDX Elliott Wave Analysis: Bullish Impulse Wave, Price Target, Support and Resistance Levels

VanEck Gold Miners ETF – GDX Elliott Wave Analysis: Bullish Impulse Wave, Price Target, Support and Resistance Levels

Elliott Wave analysis of the VanEck Gold Miners ETF (GDX), focusing on the powerful rally phase iden...

Read More >
AXIS BANK Indian Stocks Elliott Wave Technical Analysis Highlights Corrective Wave 2 Phase and Predicts Potential Bullish Breakout

AXIS BANK Indian Stocks Elliott Wave Technical Analysis Highlights Corrective Wave 2 Phase and Predicts Potential Bullish Breakout

AXIS BANK is in a wave 2 correction as per Elliott Wave theory, showing limited momentum before a po...

Read More >
Unlocking ASX Trading Success: V300AEQ ETF UNITS – VAS Stock Analysis & Elliott Wave Technical Forecast

Unlocking ASX Trading Success: V300AEQ ETF UNITS – VAS Stock Analysis & Elliott Wave Technical Forecast

This article provides a detailed Elliott Wave analysis of the ASX V300AEQ ETF Units - VAS. It includ...

Read More >

$1 for 2 Weeks

then $29 a month!

What a Special Offer!

Trade Recommendations

Unleash the power of deversified trading with our comprehensive portfolio, covering 250+ markets:

  • Stock Trades
  • Crypto Trades
  • Forex Trades
  • Commodity Trades
Elliott Wave Analysis

Gain a competitive edge with expert insights and AI-powered Elliott Wave charting into:

  • Global Indices
  • US Stocks & ASX Stocks
  • Forex & Crypto
  • Commodities
Top-Notch Trading Tools

Equip yourself with the tools of success:

  • Real-time Chat rooms
  • Elliott Wave Algorithm
  • Portfolio tools
  • TradingLevels
  • Screener
  • Trading Game
7 Elliott Wave Analysts

Stay ahead of the market with daily charts and insightful videos
Your secret to strategic trading!

JOIN HERE


Welcome to TradingLounge (ASIC A.R.No. 321187), specialists in trades, trading education and technical analysis, covering stocks, indices, commodities, forex and cryptocurrencies.

When you join TradingLounge you have access to everything we offer, including trade tools, educational content and a social platform to chat with like-minded investors.

Read more

@Copyright 2024 by tradinglounge.com

Contact Us

Australian no: 02 4787 6020

International no: +61 (2) 47876020

Pay with:

Find us on