TradingLounge Commodity Copper Elliott Wave Analysis
Function - Counter-Trend
Mode - Impulse wave a of (IV)
Structure - Impulse wave
Position - Wave (B) of b
Direction - Wave
Direction - Wave (C) of b
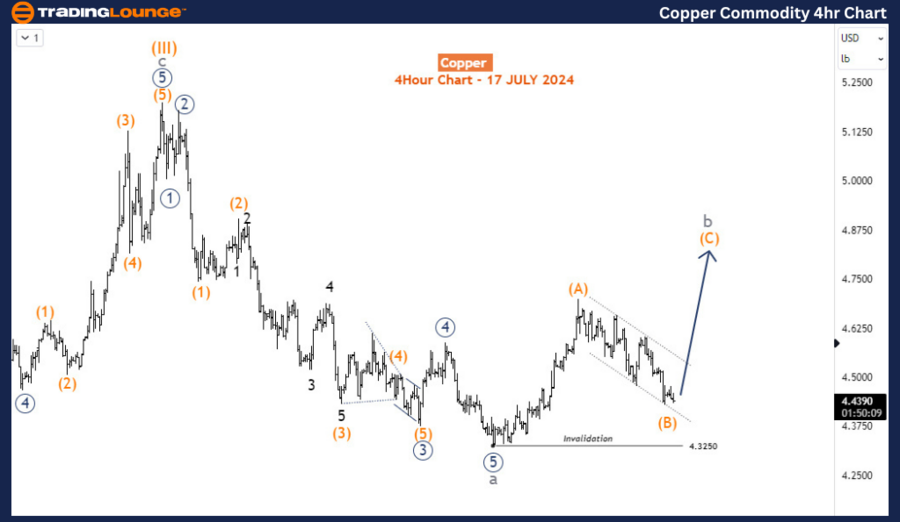
Details - The count now favors at least an (A)-(B)-(C) bullish correction with wave (A) appearing to have been completed. The current wave (B) dip is close to completion ahead of a further surge for wave (C) if 4.325 is not breached.
Copper Elliott Wave Technical Analysis and Copper Market Analysis
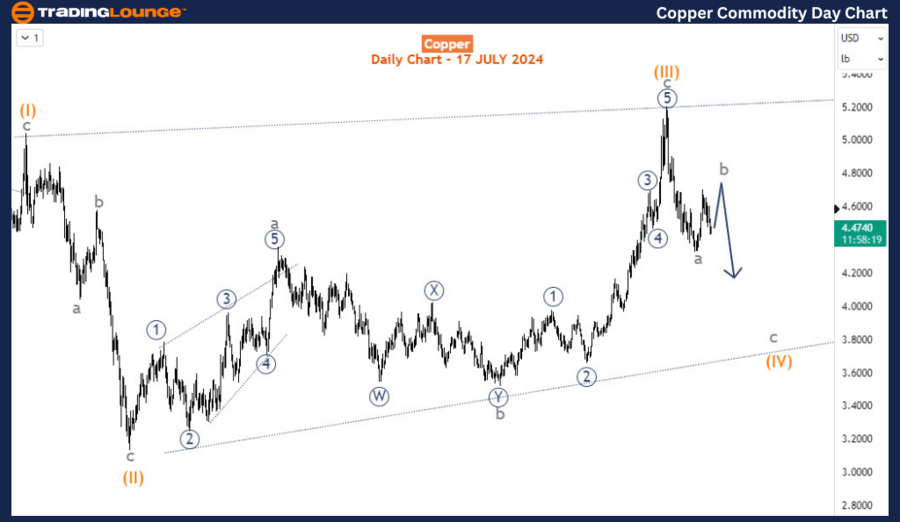
As an Elliott Wave analyst, the recent movements in the copper market present a compelling scenario. Since May 17th, 2024, copper has declined nearly 14%, correcting the robust rally that began in October 2023. This correction appears to be forming a 3-swing chart structure, with potential for further downside before resuming the long-term uptrend. However, caution is advised for buyers as the commodity may continue its corrective decline for several more weeks.
Copper Daily Chart Analysis
On the daily chart, we anticipate a 3-wave decline from the high in May 2024, labeled as waves a-b-c of the cycle degree, to complete wave (IV) of the supercycle degree. Wave a seems to have completed, and the price is now correcting upwards for wave b. Within wave b, the first sub-wave has finished, and the second sub-wave is nearing completion. We expect one more leg higher, potentially reaching a fresh high since July 2024, before the price resumes its larger bearish correction towards the $3.75-$4.00 range.

Copper H4 Chart Analysis
The H4 chart provides a detailed view of wave b, which started at 4.325. The current dip for wave (B) of b is expected to find support above this level. Subsequently, we anticipate an upward break toward the 4.8-5.0 range, where wave (B) of c may complete. Following this, the price is likely to turn lower again.
Trading Path
Short-term traders should consider buying along the path of wave (C), taking advantage of the anticipated upward movement. Swing traders, on the other hand, should wait for the conclusion of wave (C) to complete the cycle degree wave b, then sell along the path of wave c towards the $4.00 mark.
Summary
In summary, the Elliott Wave analysis suggests that copper is amid a corrective decline from its May 2024 high, with potential for further downside before resuming its long-term uptrend. The key levels to watch include the 4.325 support level for wave (B) of b and the 4.8-5.0 range for the completion of wave (B) of c. Short-term traders may find buying opportunities along wave (C), while swing traders should prepare to sell after wave (C) completes, targeting the $4.00 mark. This analysis highlights the importance of closely monitoring wave structures and key price levels to anticipate future movements in the copper market.
Technical Analyst: Sanmi Adeagbo
Source: visit Tradinglounge.com and learn From the Experts Join TradingLounge Here
See Previous: Silver Elliott Wave Technical Analysis
Special Trial Offer - 0.76 Cents a Day for 3 Months! Click here
Access 7 Analysts Over 170 Markets Covered. Chat Room With Support
