08Nov

Visa Inc. (V) Stock Analysis: Elliott Wave Insights, Price Forecasts & Trading Trends with Daily and Hourly Chart Breakdowns

Visa Inc. (V) Elliott Wave Analysis: Daily and 1-Hour Charts

This analysis evaluates Visa Inc. (V) using Elliott Wave Theory to interpret current market trends and predict potential future price movements. Both the daily and 1-hour charts are analyzed for an in-depth perspective.

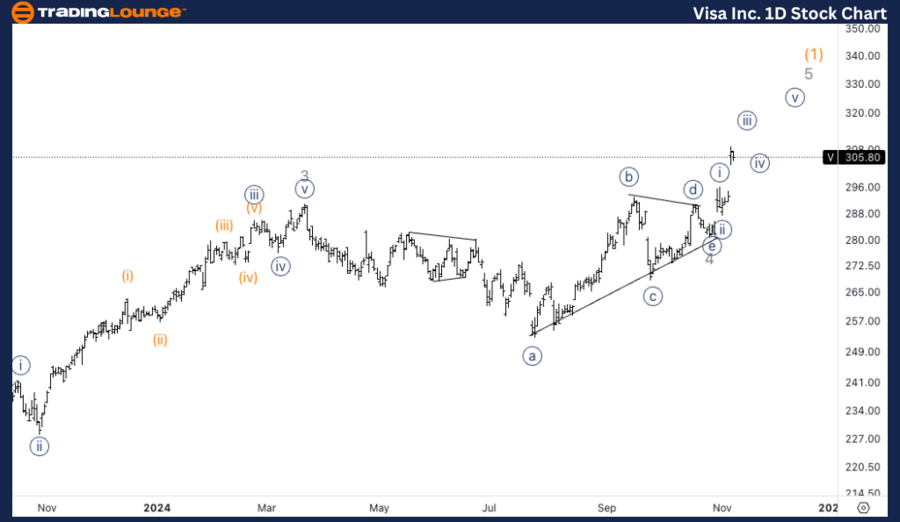
V Elliott Wave Analysis - TradingLounge Daily Chart

Visa Inc. (V) Daily Chart Overview

Visa Inc. V Elliott Wave Technical Analysis

Function: Trend

Mode: Impulsive

Structure: Motive

Position: Wave 5 of (1)

Direction: Upward in Wave 5

Details: Visa has recently surpassed the significant resistance at TradingLevel 3 ($300). The continuation of Wave (1) suggests further upside momentum, but resistance could emerge within MinorGroup1, particularly around $320.

Visa Inc. (V) Daily Chart Insights

Visa is advancing in Wave 5 of an impulsive pattern within Wave (1). After breaching the pivotal $300 TradingLevel 3, the stock shows bullish momentum. However, resistance near MinorGroup1 ($320) may temporarily pause the rally as the market consolidates. Despite potential short-term pullbacks, the long-term outlook remains positive, with Wave 5 expected to continue upward as Wave (1) unfolds further.

Visa-Inc-1D-Stock-Ch...


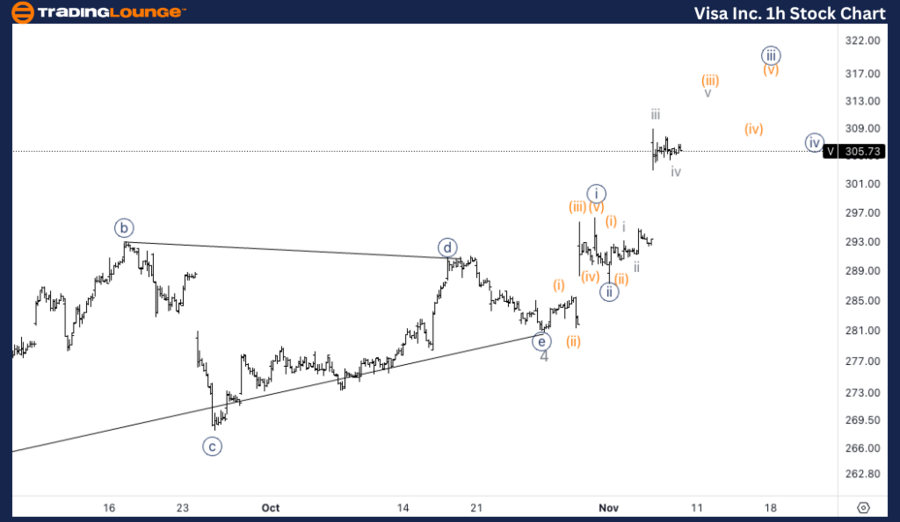
V Elliott Wave Analysis - TradingLounge1-Hour Chart

Visa Inc. (V) 1-Hour Chart Overview

Stock Technical Analysis

Function: Trend

Mode: Impulsive

Structure: Motive

Position: Wave (iii) of {iii}

Direction: Upward in Wave (iii)

Details: The stock's recent upward gaps validate the assumption of a strong rally in Wave (iii) of {iii}. As the stock approaches MinorGroup1 ($300), a series of pullbacks or consolidations may emerge.

1-Hour Chart Insights

The 1-hour chart indicates Visa is in a robust upward move within Wave (iii) of {iii} of Wave 5. The recent price gaps affirm bullish momentum in this impulsive rally. Approaching MinorGroup1 ($300), minor pullbacks or consolidation phases are expected, potentially offering strategic entry points. The ongoing rally in Wave (iii) of {iii} underscores strong bullish momentum.

Technical Analyst: Alessio Barretta

Source: visit Tradinglounge.com and learn From the Experts Join TradingLounge Here 

See Previous: Deere & Co. (DE) Elliott Wave Technical Analysis

VALUE Offer - Buy 1 Month & Get 3 Months!Click here

Access 7 Analysts Over 200 Markets Covered. Chat Room With Support

Visa-Inc-1h-Stock-Ch...

Related

Bitcoin / U.S. dollar(BTCUSD) Elliott Wave Technical Analysis 13 November 23

Bitcoin / U.S. dollar(BTCUSD) Elliott Wave Technical Analysis 13 November 23

Bitcoin/U.S. dollar(BTCUSD) Elliott Wave Technical Analysis on 13 November 23 with BTCUSD Analysis D...

Read More >
U.S. Dollar/Canadian Dollar (USDCAD) Forex Elliott Wave Technical Analysis: Risk management and technical analysis for Forex trading

U.S. Dollar/Canadian Dollar (USDCAD) Forex Elliott Wave Technical Analysis: Risk management and technical analysis for Forex trading

Get detailed USD/CAD Elliott Wave analysis for both daily and 4-hour charts. Learn about counter-tre...

Read More >
INFOSYS – INFY Stock Elliott Wave Technical Analysis: Is a Major Top Forming? Prepare for Potential Correction

INFOSYS – INFY Stock Elliott Wave Technical Analysis: Is a Major Top Forming? Prepare for Potential Correction

This detailed Elliott Wave analysis of Infosys stock explores the recent price trends and potential ...

Read More >
Unlocking ASX Trading Success: BLOCK INC. - SQ2 Stock Analysis & Elliott Wave Technical Forecast

Unlocking ASX Trading Success: BLOCK INC. - SQ2 Stock Analysis & Elliott Wave Technical Forecast

This article provides an expert Elliott Wave analysis of BLOCK INC. - SQ2 on the Australian Stock Ex...

Read More >
Understand Price Movements and Forecast Trends: Cardano Crypto Price News Today Elliott Wave Technical Analysis

Understand Price Movements and Forecast Trends: Cardano Crypto Price News Today Elliott Wave Technical Analysis

Discover in-depth Elliott Wave analysis for Cardano (ADAUSD) to understand price movements and forec...

Read More >

Buy 1 Month

Get 3 Months!

Special Offer:

Trade Recommendations

Unleash the power of deversified trading with our comprehensive portfolio, covering:

  • Stock Trades
  • Crypto Trades
  • Forex Trades
  • Commodity Trades
Elliott Wave Analysis

Gain a competive edge with expert insights in to:

  • Global Indices
  • US Stocks & ASX Stocks
  • Forex & Crypto
  • Commodities
Top-Notch Trading Tools

Equip yourself with the tools of success:

  • Social Chat
  • Elliott Wave Algorithm
  • Screener
  • TradingLevels
  • Trading Game
7 Elliott Wave Analysts

Stay ahead of the market with daily charts and insightful videos
-Your secret to strategic trading!

JOIN HERE


Welcome to TradingLounge (ASIC A.R.No. 321187), specialists in trades, trading education and technical analysis, covering stocks, indices, commodities, forex and cryptocurrencies.

When you join TradingLounge you have access to everything we offer, including trade tools, educational content and a social platform to chat with like-minded investors.

Read more

@Copyright 2024 by tradinglounge.com

Contact Us

Australian no: 02 4787 6020

International no: +61 (2) 47876020

Pay with:

Find us on