TITAN COMPANY (TITAN) Elliott Wave Analysis-TradingLounge 1D Chart

ITAN COMPANY 1 Day Chart Analysis

TITAN Elliott Wave Technical Analysis

Function: Counter Trend (Intermediate Degree, Orange)

Mode: Corrective

Structure: Impulse within Larger Degree Corrective Wave

Position: Minor Wave 2 Grey

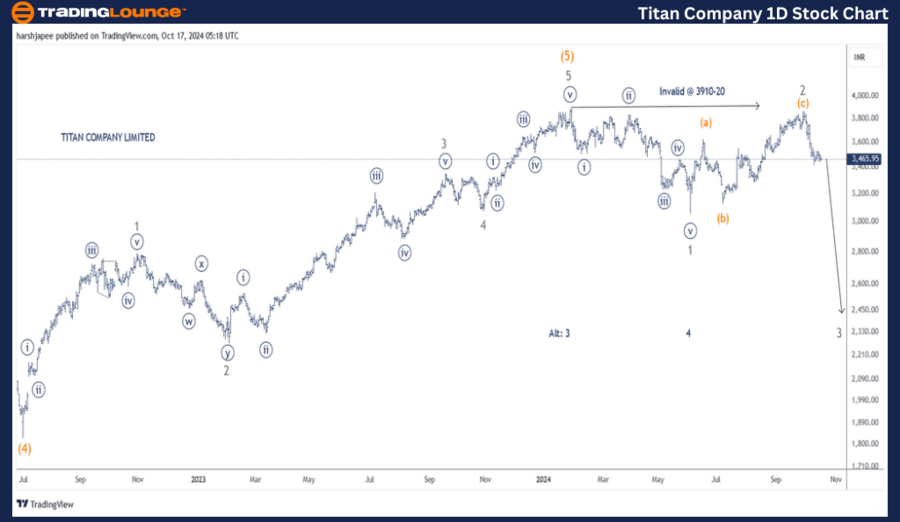
Details: The stock may have formed a top around the 3920 level earlier. Additionally, an impulse drop has been seen, finishing just above the 3000 mark, followed by a corrective rally between the 3780-3870 levels. Currently, the stock is turning lower as Minor Wave 3 Grey progresses, working against the 3920 level. Alternative counts are indicated on the chart, which will be evaluated if the price action aligns.

Invalidation Point: 3910-3920

TITAN Company Daily Chart Technical Analysis and Elliott Wave Forecast

The daily chart for TITAN Company suggests that a major top has formed around the 3910-3920 range, signaling the potential completion of Intermediate Wave (5) Orange. The stock has since moved lower, with Minor Waves 1 and 2 Grey forming near 3060 and 3800, respectively. There is a possibility that Minor Wave 3 Grey is currently unfolding.

In July 2022, the stock dropped near the 1830 mark, marking the end of Intermediate Wave (4) Orange. Following this, the price moved upward in a five-wave structure, marked as Minor Waves 1 through 5. If this analysis is correct, a larger degree corrective wave has started.

Alternative Scenario: The peak around 3910-3920 may represent Minor Wave 3, followed by Minor Wave 4 finishing near the 3060 level. In this scenario, Minor Wave 5 could be moving higher, potentially breaking through the 3910-3920 range.

Titan-Company-1D-Sto...


ITAN COMPANY (TITAN) Elliott Wave Analysis-TradingLounge 4H Chart

TITAN COMPANY – TITAN (4H Chart) Elliott Wave Technical Analysis

Function: Counter Trend (Intermediate Degree, Orange)

Mode: Corrective

Structure: Impulse within Larger Degree Corrective Wave

Position: Minor Wave 2 Grey

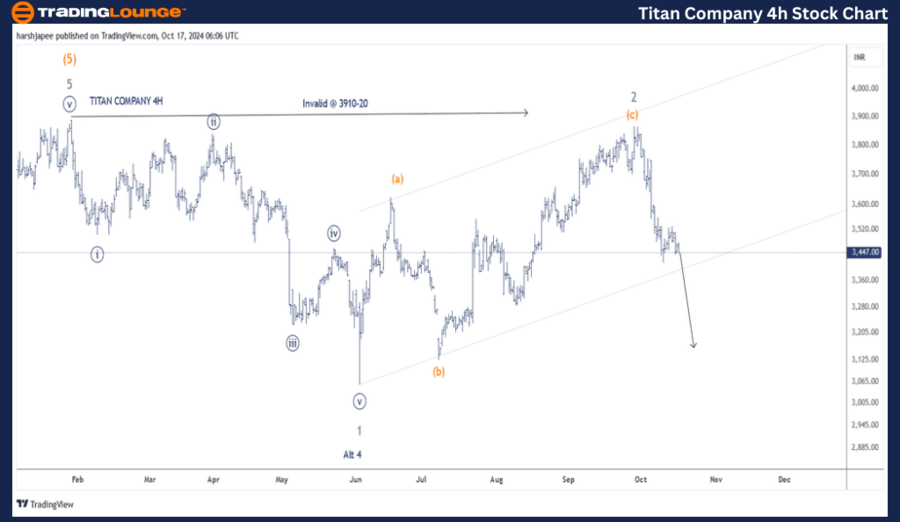
Details: The stock may have formed a top around the 3920 level earlier. An impulse drop followed, completing just above the 3000 mark, followed by a corrective rally between 3780-3870. Currently, the stock has started moving lower as Minor Wave 3 Grey unfolds, working against the 3920 level. A break below 3145 would confirm the bearish outlook. Alternative wave counts are shown on the chart, which will be revisited if price action behaves as expected.

Invalidation Point: 3910-3920

TITAN Company 4H Chart Technical Analysis and Elliott Wave Forecast

The 4H chart of TITAN Company shows a potential impulse drop from the 3910-3920 high, labeled as Minor Wave 1, followed by a corrective rally to 3800, marked as Minor Wave 2. If this wave count is correct, Minor Wave 3 is now moving downward.

Technical Analyst: Harsh Japee

Source: visit Tradinglounge.com and learn From the Experts Join TradingLounge Here 

Previous: JSW Steel Elliott Wave Technical Analysis

VALUE Offer - Buy 1 Month & Get 3 Months!Click here

Access 7 Analysts Over 200 Markets Covered. Chat Room With Support

Titan-Company-4h-Sto...


Conclusion:

TITAN Company appears to be trending lower as Minor Wave 3 Grey progresses, acting against the 3910-3920 resistance zone.

Related

Trading Strategies to Navigate the Polkadot Cryptocurrency Market Confidently With DOTUSD Elliott Wave Technical Analysis

Trading Strategies to Navigate the Polkadot Cryptocurrency Market Confidently With DOTUSD Elliott Wave Technical Analysis

This comprehensive analysis of DOTUSD provides insights into Polkadot's price trends using Ellio...

Read More >
Reliance Industries Stocks Elliott Wave Technical Analysis: Insights into Daily and 4-Hour Charts and Long-Term Market Outlook

Reliance Industries Stocks Elliott Wave Technical Analysis: Insights into Daily and 4-Hour Charts and Long-Term Market Outlook

This article provides a Technical analysis of Reliance Industries using the Elliott Wave theory. It ...

Read More >
Stay Informed on Commodity Market: GX Uranium ETF (URA) Elliott Wave Technical Analysis

Stay Informed on Commodity Market: GX Uranium ETF (URA) Elliott Wave Technical Analysis

The Global X Uranium ETF (GX URA) offers investors a diversified portfolio of companies engaged in u...

Read More >
Adani Enterprises Elliott Wave Analysis: Technical Insights, Price Predictions, and Chart Analysis for Informed Trading Decisions

Adani Enterprises Elliott Wave Analysis: Technical Insights, Price Predictions, and Chart Analysis for Informed Trading Decisions

A comprehensive Elliott Wave analysis of Adani Enterprises discovers insights into the stock's c...

Read More >
VanEck Rare Earth & Strategic Metals ETF (REMX) Elliott Wave Analysis: Zigzag Pattern, and ETF Trading Strategy Insights

VanEck Rare Earth & Strategic Metals ETF (REMX) Elliott Wave Analysis: Zigzag Pattern, and ETF Trading Strategy Insights

VanEck Rare Earth & Strategic Metals ETF (REMX), focusing on the wave 4 correction within a zigzag s...

Read More >
RUSSELL 2000 Index Elliott Wave Technical Analysis: Best Stocks to buy and Market Forecasts

RUSSELL 2000 Index Elliott Wave Technical Analysis: Best Stocks to buy and Market Forecasts

This article offers an in-depth Elliott Wave analysis of the Russell 2000, providing valuable insigh...

Read More >

$1 for 2 Weeks

then $29 a month!

What a Special Offer!

Trade Recommendations

Unleash the power of deversified trading with our comprehensive portfolio, covering 250+ markets:

  • Stock Trades
  • Crypto Trades
  • Forex Trades
  • Commodity Trades
Elliott Wave Analysis

Gain a competitive edge with expert insights and AI-powered Elliott Wave charting into:

  • Global Indices
  • US Stocks & ASX Stocks
  • Forex & Crypto
  • Commodities
Top-Notch Trading Tools

Equip yourself with the tools of success:

  • Real-time Chat rooms
  • Elliott Wave Algorithm
  • Portfolio tools
  • TradingLevels
  • Screener
  • Trading Game
7 Elliott Wave Analysts

Stay ahead of the market with daily charts and insightful videos
Your secret to strategic trading!

JOIN HERE


Welcome to TradingLounge (ASIC A.R.No. 321187), specialists in trades, trading education and technical analysis, covering stocks, indices, commodities, forex and cryptocurrencies.

When you join TradingLounge you have access to everything we offer, including trade tools, educational content and a social platform to chat with like-minded investors.

Read more

@Copyright 2024 by tradinglounge.com

Contact Us

Australian no: 02 4787 6020

International no: +61 (2) 47876020

Pay with:

Find us on