Netflix Inc., Elliott Wave Technical Analysis

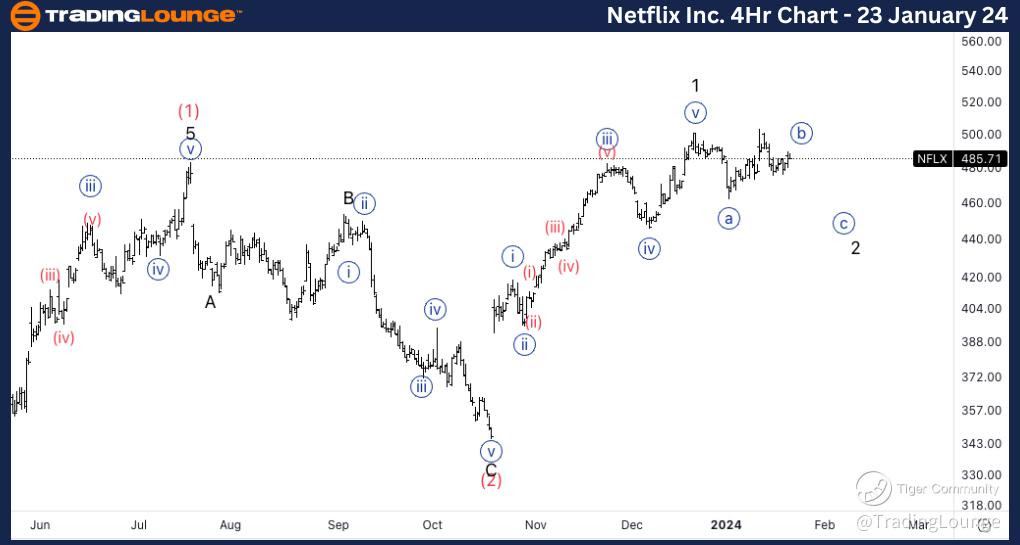
Netflix Inc., (NFLX:NYSE): 4h Chart 23 January 24

NFLX Stock Market Analysis: We have been monitoring this wave {b} in Netflix for some time. It looks like we are starting to move sideways, confirming the bias of a wave {b}. Looking for further downside into wave {c}.

NFLX Elliott Wave Count: Wave {c} of 2.  

NFLX Technical Indicators: Above all averages.

NFLX Trading Strategy: Looking longs after we find support on 500$.  

TradingLounge Analyst: Alessio Barretta

Source: Tradinglounge.com get trial here!

Previous: McDonald’s Corp

Netflix-Inc-4Hr-Stoc...


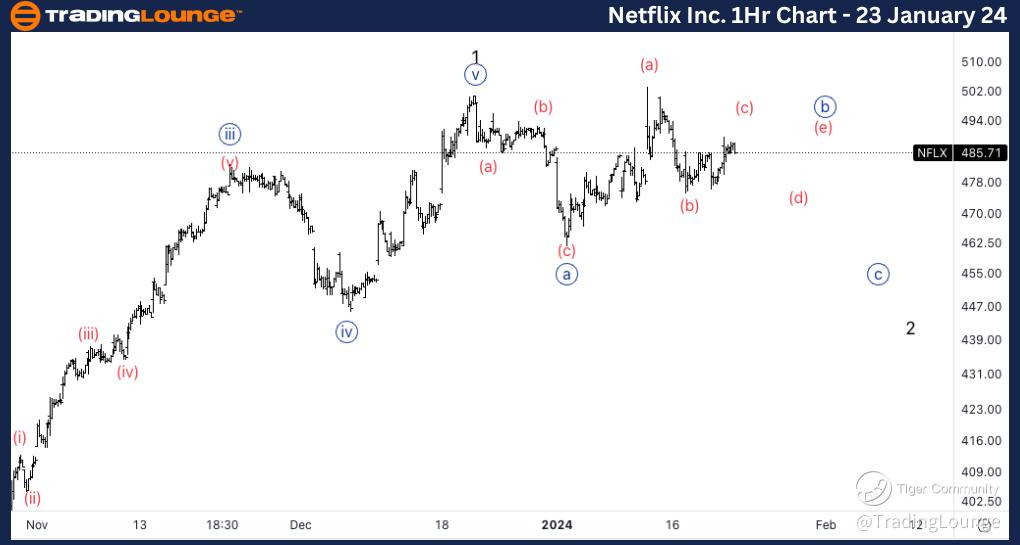
Netflix Inc., NFLX: 1-hour Chart 23 January 24

Netflix Inc., Elliott Wave Technical Analysis 

NFLX Stock Market Analysis: Looking for a potential triangle in wave {b} as shown or else a simple sideways movement. As long as we find resistance on 500$ we could even look for short term shorts into wave {c} towards 450$, knowing we’d be trading against the main trend.  

NFLX Elliott Wave count:  Wave {b} of 2.  

NFLX Technical Indicators: Above all averages.

NFLX Trading Strategy: Looking for short term shorts below 500$.

Netflix-Inc-1Hr-Stoc...

Related

IBEX 35 Technical Analysis Using Elliott Wave Shows Bullish Momentum, Investment Outlook, and Trading Strategy Insights

IBEX 35 Technical Analysis Using Elliott Wave Shows Bullish Momentum, Investment Outlook, and Trading Strategy Insights

Elliott Wave analysis of the IBEX 35 index, highlighting its current bullish trend. Learn about wave...

Read More >
XOM Elliott Wave Technical Analysis: Unveiling Potential Upside Momentum in Exxon Mobil Corp. (XOM)

XOM Elliott Wave Technical Analysis: Unveiling Potential Upside Momentum in Exxon Mobil Corp. (XOM)

Explore the Elliott Wave analysis of Exxon Mobil Corp. (XOM) on March 12, 2024, revealing a bullish ...

Read More >
NASDAQ Elliott Wave Analysis: Expert Forecasts, Bullish Trend Insights, and Trading Strategies for Daily and Weekly Chart Success

NASDAQ Elliott Wave Analysis: Expert Forecasts, Bullish Trend Insights, and Trading Strategies for Daily and Weekly Chart Success

Get expert NASDAQ Elliott Wave analysis highlighting bullish trends, price forecasts, and trading st...

Read More >
SPDR Select Sector Fund ETF – XLF Elliott Wave Analysis Projects Wave 3 Breakout with Key Support and Bullish ETF Trading Opportunity

SPDR Select Sector Fund ETF – XLF Elliott Wave Analysis Projects Wave 3 Breakout with Key Support and Bullish ETF Trading Opportunity

XLF is in a bullish wave 3 with targets beyond $52.64. This Elliott Wave analysis highlights key bre...

Read More >
Bitcoin/U.S. dollar(BTCUSD) Elliott Wave Technical Analysis 31 October 23

Bitcoin/U.S. dollar(BTCUSD) Elliott Wave Technical Analysis 31 October 23

Bitcoin/U.S. dollar(BTCUSD) Elliott Wave Technical Analysis on 31 October 23 with BTCUSD Analysis Da...

Read More >

Buy 1 Month

Get 3 Months!

Special Offer:

Trade Recommendations

Unleash the power of deversified trading with our comprehensive portfolio, covering:

  • Stock Trades
  • Crypto Trades
  • Forex Trades
  • Commodity Trades
Elliott Wave Analysis

Gain a competive edge with expert insights in to:

  • Global Indices
  • US Stocks & ASX Stocks
  • Forex & Crypto
  • Commodities
Top-Notch Trading Tools

Equip yourself with the tools of success:

  • Social Chat
  • Elliott Wave Algorithm
  • Screener
  • TradingLevels
  • Trading Game
7 Elliott Wave Analysts

Stay ahead of the market with daily charts and insightful videos
-Your secret to strategic trading!

JOIN HERE


Welcome to TradingLounge (ASIC A.R.No. 321187), specialists in trades, trading education and technical analysis, covering stocks, indices, commodities, forex and cryptocurrencies.

When you join TradingLounge you have access to everything we offer, including trade tools, educational content and a social platform to chat with like-minded investors.

Read more

@Copyright 2024 by tradinglounge.com

Contact Us

Australian no: 02 4787 6020

International no: +61 (2) 47876020

Pay with:

Find us on