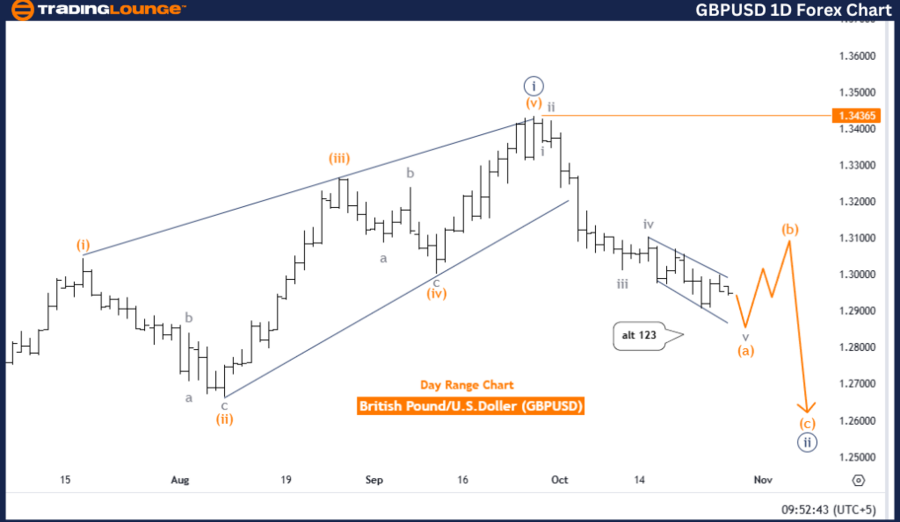
GBPUSD Elliott Wave Analysis - Trading Lounge Day Chart
British Pound / U.S. Dollar Technical Chart Analysis
GBPUSD Elliott Wave Technical Analysis
Function: Counter Trend
Mode: Impulsive
Structure: Orange Wave A
Position: Navy Blue Wave 2
Direction Next Higher Degrees: Orange Wave B
Details: The ongoing Elliott Wave analysis of GBPUSD on the daily chart reveals a counter-trend pattern with an active impulsive wave, identified as orange wave A, currently operating within navy blue wave 2. This pattern suggests that orange wave A is progressing as a corrective move within the broader downtrend and is approaching its end. Upon completion of orange wave A, the expectation is for orange wave B to commence, ushering in a temporary corrective phase that diverges from the prevailing downtrend.
Positioning of Navy Blue Wave 2:
Navy blue wave 2 continues in action but is close to its endpoint, potentially transitioning to orange wave B. In Elliott Wave theory, this shift often signals a temporary reversal or pause in the main trend, offering traders an opportunity to anticipate a corrective move.
Wave Cancellation Level:
The invalidation level for this wave structure is set at 1.34365. If the price exceeds this level, the current wave configuration would be invalidated, suggesting a potential trend shift that would necessitate a reevaluation of the Elliott Wave analysis. As long as the price remains below this threshold, the anticipated transition toward orange wave B is likely, affirming the counter-trend setup.
Summary:
The GBPUSD daily chart outlines a counter-trend setup, with orange wave A approaching completion and anticipated to shift into orange wave B. This shift may prompt a corrective phase within the broader wave framework, with 1.34365 serving as a critical confirmation level for this structure. The transition from wave A to wave B could moderate the downtrend momentarily.

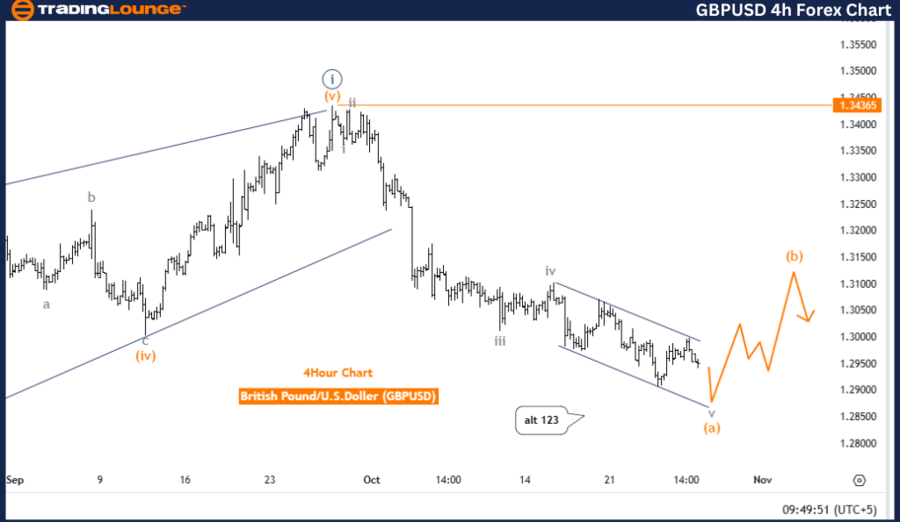
British Pound / U.S. Dollar (GBPUSD) 4-Hour Chart
GBPUSD Forex Pair Technical Analysis
Function: Counter Trend
Mode: Impulsive
Structure: Orange Wave A
Position: Navy Blue Wave 2
Direction Next Higher Degrees: Orange Wave B
Details:
The four-hour Elliott Wave analysis for GBPUSD indicates a counter-trend movement within an impulsive wave, specifically orange wave A. Positioned within navy blue wave 2, GBPUSD forms part of the larger orange wave A structure, signaling a temporary corrective phase within the broader trend. The analysis points toward orange wave A nearing its end, setting up a potential transition to orange wave B, which may trigger a temporary reversal or corrective phase.
Impulsive and Corrective Waves:
In Elliott Wave analysis, impulsive waves like wave A often denote strong directional movement, whereas corrective waves like wave B signify pullbacks or retracements in the opposing direction. The potential shift from wave A to wave B could indicate a shift in market sentiment as traders adjust to the expected conclusion of wave A. Should orange wave A complete as anticipated, it would likely transition into a corrective phase under orange wave B, contributing to the counter-trend within the broader wave cycle.
Wave Cancellation Level:
The invalidation level for this wave structure is also set at 1.34365, a key threshold. A breach above this level would invalidate the current wave configuration, requiring a reassessment of the trend. If GBPUSD stays below this level, the Elliott Wave structure remains intact.
Summary:
On the GBPUSD 4-hour chart, the analysis shows an impulsive counter-trend under orange wave A, potentially transitioning to orange wave B. The short-term outlook depends on the completion of wave A, with 1.34365 serving as a critical level for confirming the structure’s validity. The current wave pattern suggests a probable corrective reversal as wave B begins.
Technical Analyst: Malik Awais
Source: visit Tradinglounge.com and learn From the Experts Join TradingLounge Here
Previous: Euro/U.S. Dollar (EURUSD) Elliott Wave Technical Analysis
VALUE Offer - Buy 1 Month & Get 3 Months!Click here
Access 7 Analysts Over 200 Markets Covered. Chat Room With Support
