TradingLounge Overview of NEO/USD in Elliott Wave Framework
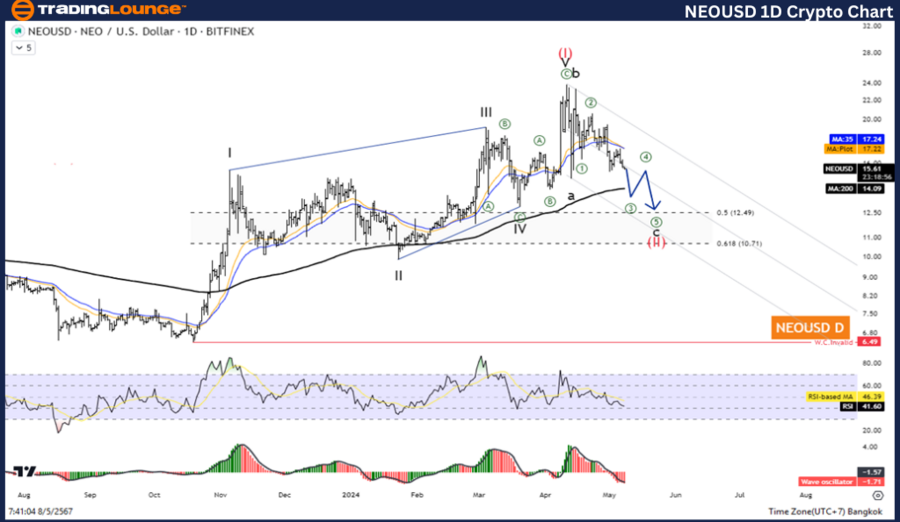
NEO/ U.S. dollar(NEOUSD) Daily Chart Analysis
NEOUSD Elliott Wave Technical Analysis
Position and Current Phase:
- Function: Counter Trend
- Mode: Corrective
- Structure: Flat
- Current Position: Wave B
- Next Higher Degrees: Projecting Wave (II) of Impulse
- Invalidation Level: 9.85
- Key Fibonacci Level: Wave (II) measures 61.8% of Wave (I) at the 10.71 level
Trading Strategy for NEO/USD Based on Elliott Wave Analysis
As NEOUSD navigates a complex market phase, understanding its Elliott Wave structure is crucial for effective trading. Currently, NEOUSD is in a counter-trend phase characterized by a flat corrective structure. Traders should note the currency pair is in Wave B, which suggests a short-term pullback. The market anticipates a descent into Wave C following the completion of the current correction. Investors are advised to wait for this corrective phase to conclude before re-entering the market to capitalize on the expected uptrend resumption.
Technical Indicators Supporting the Elliott Wave Perspective
- Moving Average (MA200): NEO/USD is trading above the 200-day moving average, indicating a long-term uptrend.
- Wave Oscillator: Current readings show bullish momentum, supporting the potential for upward movement once the ongoing correction phase ends.
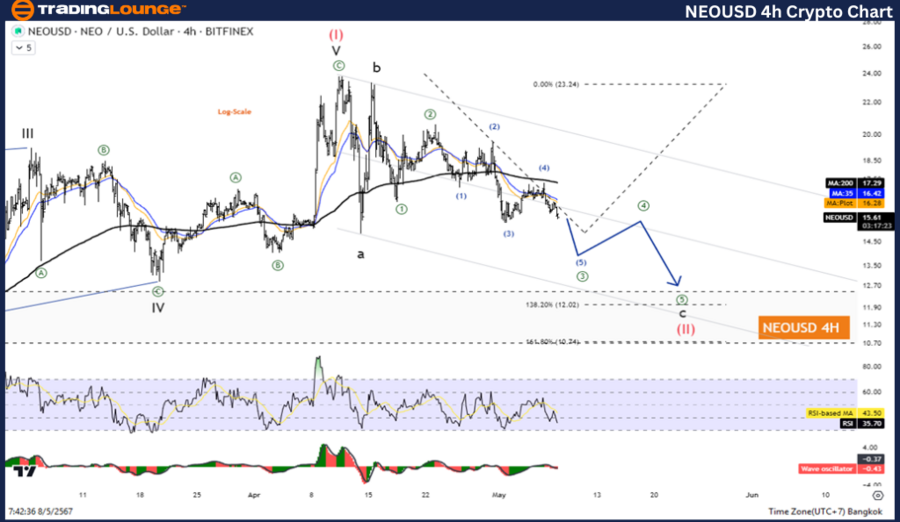
Detailed Elliott Wave Analysis on NEOUSD H4 Chart
NEO/ U.S. dollar(NEOUSD) 4-Hoyur Chart Analysis
NEOUSD Technical Analysis
Position and Current Phase:
- Function: Counter Trend
- Mode: Corrective
- Structure: Flat
- Current Position: Wave B
- Next Higher Degrees: Looking towards Wave (II) of an Impulse
- Invalidation Level: 9.85
- Fibonacci Observation: Consistency is noted as Wave (II) also equates to 61.8% of Wave (I) at 10.71
NEO/USD Trading Strategy for Short-Term Traders
For short-term trading on the H4 charts, NEOUSD presents a similar scenario. The cryptocurrency is currently experiencing a corrective wave in a flat pattern, identified as Wave B. This indicates a potential for further decline into Wave C. Traders should prepare for a subsequent rise, marking the commencement of the third wave. Observing the end of the current wave B's correction will be key to timing entries for riding the next bullish wave.
Key Technical Indicators for H4 Chart Analysis
- MA200 Position: The consistent positioning above the 200-day moving average confirms the overarching bullish sentiment in the market.
- Wave Oscillator: The oscillator maintains bullish momentum, echoing the daily chart’s indications and supporting bullish forecasts post-correction.
Technical Analyst: Kittiampon Somboonsod
Source: visit Tradinglounge.com and learn From the Experts Join TradingLounge Here
Previous: Bitcoin/ U.S. dollar(BTCUSD) Elliott Wave Analysis
Special Trial Offer - 0.76 Cents a Day for 3 Months! Click here
Access 6 Analysts covering over 150 Markets. Chat Room With Support
Conclusion and Trading Tips
The detailed Elliott Wave analysis for NEO/USD across both daily and H4 charts suggests a strategic wait-and-see approach for investors and traders. The ongoing correction in Wave B across both time frames is a preparatory phase before a more significant bullish trend resumes. By aligning trades with the completion of this corrective wave and the commencement of the third impulse wave, traders can maximize their potential for gains. Monitoring the MA200 and wave oscillator will provide additional confirmation for entering trades at optimal times.