08Apr

COAL INDIA Elliott Wave Chart Analysis Highlights Corrective Wave B and Bearish Continuation into Wave C with Key Invalidation Level

COAL INDIA Elliott Wave Analysis – TradingLounge Daily Chart

COAL INDIA Stock Overview & Technical Insight

COAL INDIA Elliott Wave Technical Analysis

Function: Counter-Trend

Mode: Corrective

Structure: Gray Wave B

Position: Orange Wave 4

Next Lower Degree Direction: Gray Wave C

Invalidation Level: 543.16

Analysis Overview:

COAL INDIA’s daily chart reveals a counter-trend corrective pattern within a larger Elliott Wave cycle. The focus is on Gray Wave B, part of the broader Orange Wave 4 structure.

According to Elliott Wave principles, Gray Wave A has likely completed its downward leg, and the stock is now moving through Gray Wave B—signaling a corrective rebound. This wave represents a temporary pause in the downtrend before transitioning into Gray Wave C, continuing the bearish move.

The key invalidation level is 543.16. A break above this price invalidates the current wave count.

Structural Insight & Strategic Outlook:
Gray Wave B, positioned within Orange Wave 4, suggests a mid-trend corrective retracement. Traders should watch for classic correction patterns—like three-wave moves or sideways price action—that typically develop during counter-trend phases.

Wave structure hierarchy remains critical. Upon the completion of Wave B, a decline into Wave C is expected, potentially offering renewed bearish trading setups.

Trading Considerations:

Short-Term Opportunity: Potential upside during corrective Gray Wave B.

Long-Term Strategy: Monitor for transition into bearish Gray Wave C.

Risk Level: Invalidation above 543.16.

COAL-INDIA-Day-stock...


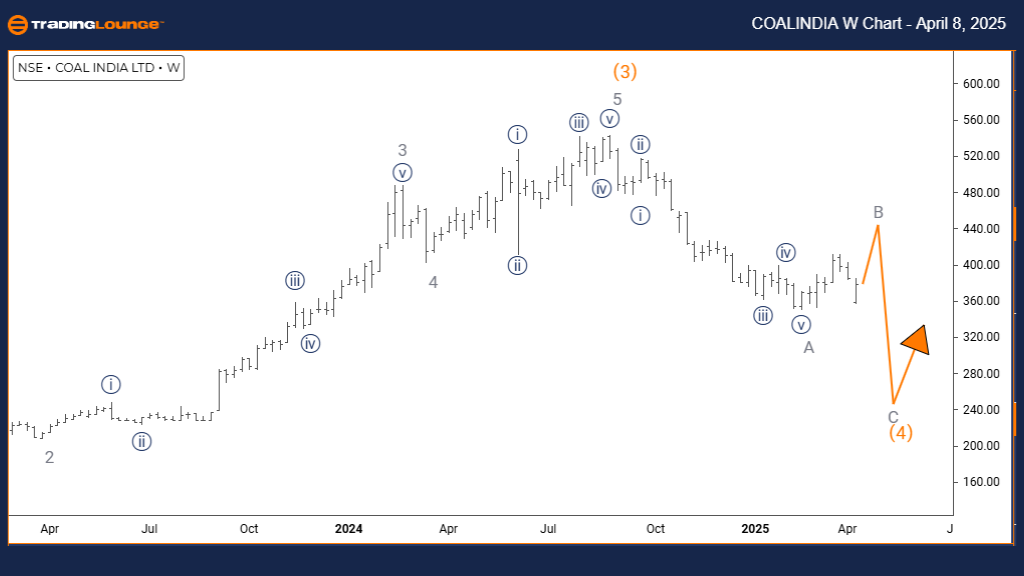
COAL INDIA Elliott Wave Analysis – TradingLounge Weekly Chart

Market Structure & Price Trend Outlook

COAL INDIA – Elliott Wave Technical Analysis

Function: Counter-Trend

Mode: Corrective

Structure: Gray Wave B

Position: Orange Wave 4

Next Lower Degree Direction: Gray Wave C

Invalidation Level: 543.16

Analysis Overview:
The weekly Elliott Wave analysis of COAL INDIA highlights a broader corrective phase within Orange Wave 4. The current active wave is Gray Wave B, part of a mid-cycle retracement.

Gray Wave A appears to have ended its downward sequence, with Gray Wave B now unfolding. This reflects a short-term counter-trend rebound within the dominant downtrend, ahead of a potential continuation via Gray Wave C.

The 543.16 level stands as a crucial invalidation point—surpassing it would negate this wave count.

Strategic Structure & Market Perspective:
This longer-term view positions Gray Wave B as a part of the Orange Wave 4 correction. Traders should look for corrective formations like ABC patterns or horizontal consolidations.

Understanding wave relationships is key. A completed Wave B would likely lead into Wave C, resuming the downward trend and presenting bearish trading prospects.

Trading Considerations:

Medium-Term Opportunity: Possible gains in corrective Wave B.

Long-Term Positioning: Prepare for downside move in Wave C.

Risk Management: Key invalidation remains at 543.16.

Technical Analyst: Malik Awais

Source: visit Tradinglounge.com and learn From the Experts Join TradingLounge Here 

Previous: BAJAJ FINSERV Elliott Wave Technical Analysis

VALUE Offer - Buy 1 Month & Get 3 Months!Click here

Access 7 Analysts Over 200 Markets Covered. Chat Room With Support

COAL-INDIA-4H-stock-...

Related

Euro/U.S. Dollar (EURUSD) Elliott Wave Forecast Highlights Bullish Impulse in Wave 5 With 1.1433 Support Before Potential Correction

Euro/U.S. Dollar (EURUSD) Elliott Wave Forecast Highlights Bullish Impulse in Wave 5 With 1.1433 Support Before Potential Correction

EURUSD outlines the current bullish trend in Orange Wave 5 within Navy Blue Wave 1. It identifies 1...

Read More >
Elliott Wave Analysis: Fed Rate Cut Sparks Potential Primary Wave 4 Downtrend

Elliott Wave Analysis: Fed Rate Cut Sparks Potential Primary Wave 4 Downtrend

The Fed’s quarter-point rate cut triggered a sharp market decline, prompting close Elliott Wave scr...

Read More >
Shanghai Composite Elliott Wave Analysis Reveals Powerful Bullish Wave 3 Breakout in China’s Stock Market Trend Forecast

Shanghai Composite Elliott Wave Analysis Reveals Powerful Bullish Wave 3 Breakout in China’s Stock Market Trend Forecast

Shanghai Composite enters wave 3 of an Elliott impulsive sequence, suggesting strong bullish momentu...

Read More >
S&P 500 Elliott Wave Analysis Reveals Bullish Impulse Wave 3 Initiation with Key Support at 4796

S&P 500 Elliott Wave Analysis Reveals Bullish Impulse Wave 3 Initiation with Key Support at 4796

The S&P 500 exhibits a bullish Elliott Wave pattern, indicating a strong upward trend. With the comp...

Read More >
Polkadot/U.S. dollar(DOTUSD) Elliott Wave Technical Analysis 31 January 24

Polkadot/U.S. dollar(DOTUSD) Elliott Wave Technical Analysis 31 January 24

TradingLounge Polkadot technical analysis today using Polkadot/US dollar(DOTUSD) Elliott Wave Analys...

Read More >
Bitcoin Crypto Price News Today Elliott Wave Technical Analysis: Offering valuable insights into current market trends for BTCUSD

Bitcoin Crypto Price News Today Elliott Wave Technical Analysis: Offering valuable insights into current market trends for BTCUSD

This article provides an in-depth Elliott Wave analysis of Bitcoin against the U.S. dollar (BTCUSD),...

Read More >

$1 for 2 Weeks

then $29 a month!

What a Special Offer!

Trade Recommendations

Unleash the power of deversified trading with our comprehensive portfolio, covering 250+ markets:

  • Stock Trades
  • Crypto Trades
  • Forex Trades
  • Commodity Trades
Elliott Wave Analysis

Gain a competitive edge with expert insights and AI-powered Elliott Wave charting into:

  • Global Indices
  • US Stocks & ASX Stocks
  • Forex & Crypto
  • Commodities
Top-Notch Trading Tools

Equip yourself with the tools of success:

  • Real-time Chat rooms
  • Elliott Wave Algorithm
  • Portfolio tools
  • TradingLevels
  • Screener
  • Trading Game
7 Elliott Wave Analysts

Stay ahead of the market with daily charts and insightful videos
Your secret to strategic trading!

JOIN HERE


Welcome to TradingLounge (ASIC A.R.No. 321187), specialists in trades, trading education and technical analysis, covering stocks, indices, commodities, forex and cryptocurrencies.

When you join TradingLounge you have access to everything we offer, including trade tools, educational content and a social platform to chat with like-minded investors.

Read more

@Copyright 2024 by tradinglounge.com

Contact Us

Australian no: 02 4787 6020

International no: +61 (2) 47876020

Pay with:

Find us on