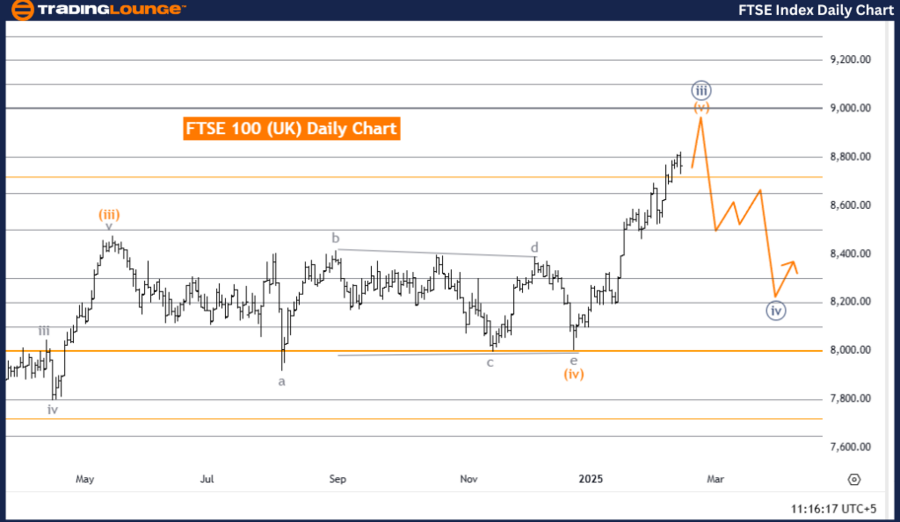
FTSE 100 (UK) Elliott Wave Analysis – Trading Lounge Daily Chart
FTSE 100 (UK) Elliott Wave Technical Analysis
Function: Trend
Mode: Impulsive
Structure: Orange Wave 5
Position: Navy Blue Wave 3
Next Lower Degree Direction: Navy Blue Wave 4
Analysis Details:
The FTSE 100 daily chart confirms a strong bullish trend, forming an impulsive Elliott Wave structure. The market is currently advancing in Orange Wave 5 following the completion of Orange Wave 4, reinforcing the upward momentum and suggesting further price gains.
The index is positioned in Navy Blue Wave 3, indicating that the broader uptrend remains intact. As Orange Wave 5 unfolds, price action is expected to continue rising before transitioning into the corrective phase (Navy Blue Wave 4).
The next wave to monitor is Navy Blue Wave 4, which will materialize after Orange Wave 5 completes. This implies that once the current uptrend slows, a short-term pullback or consolidation is likely before the bullish momentum resumes.
Conclusion:
The FTSE 100 daily chart maintains its strong bullish structure, with Orange Wave 5 in progress. The upcoming Elliott Wave phase will be Navy Blue Wave 4, potentially triggering a temporary downward correction before the trend continues higher. As long as the wave count remains intact, further gains are expected over the long term.
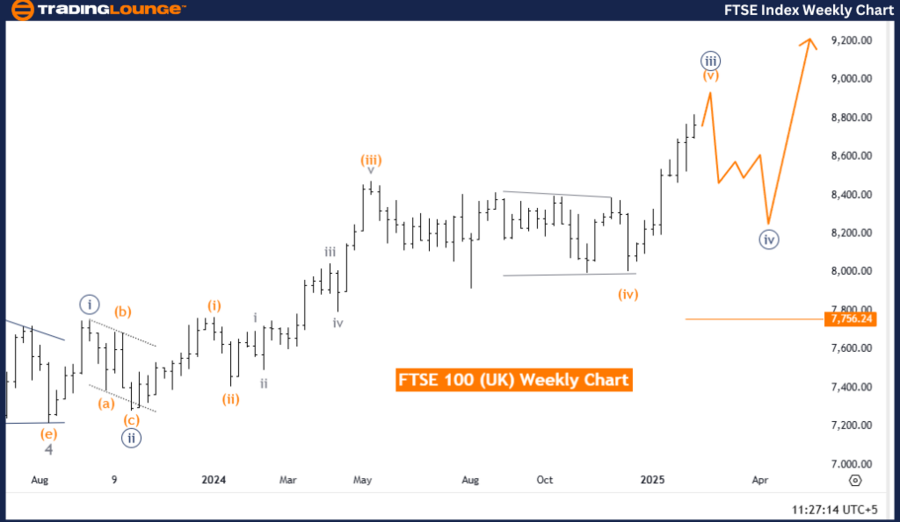
FTSE 100 (UK) Elliott Wave Analysis – Trading Lounge Weekly Chart
FTSE 100 (UK) Elliott Wave Technical Analysis
Function: Trend
Mode: Impulsive
Structure: Orange Wave 5
Position: Navy Blue Wave 3
Next Lower Degree Direction: Navy Blue Wave 4
Invalidation Level: 7,756.24
Analysis Details:
The FTSE 100 weekly chart highlights a bullish Elliott Wave formation, with the index currently positioned in Orange Wave 5, having completed Orange Wave 4. This suggests that upward momentum remains dominant, driving further price gains.
The market is progressing in Navy Blue Wave 3, reinforcing the long-term uptrend. As Orange Wave 5 plays out, the price is expected to continue rising before transitioning into Navy Blue Wave 4, marking the next corrective phase.
The key level to watch is 7,756.24, serving as the invalidation point for the current wave count. A break below this level would necessitate a reassessment of the Elliott Wave structure. However, as long as the FTSE 100 stays above 7,756.24, the bullish outlook remains intact, projecting further price appreciation.
Conclusion:
The FTSE 100 weekly chart confirms continued bullish momentum, with Orange Wave 5 advancing. The next Elliott Wave phase, Navy Blue Wave 4, may introduce a temporary downward correction before the trend resumes upward. As long as the structure remains valid, further long-term gains are anticipated.
Technical Analyst: Malik Awais
Source: visit Tradinglounge.com and learn From the Experts Join TradingLounge Here
Previous: NIFTY 50 Elliott Wave Technical Analysis
VALUE Offer - Buy 1 Month & Get 3 Months!Click here
Access 7 Analysts Over 200 Markets Covered. Chat Room With Support