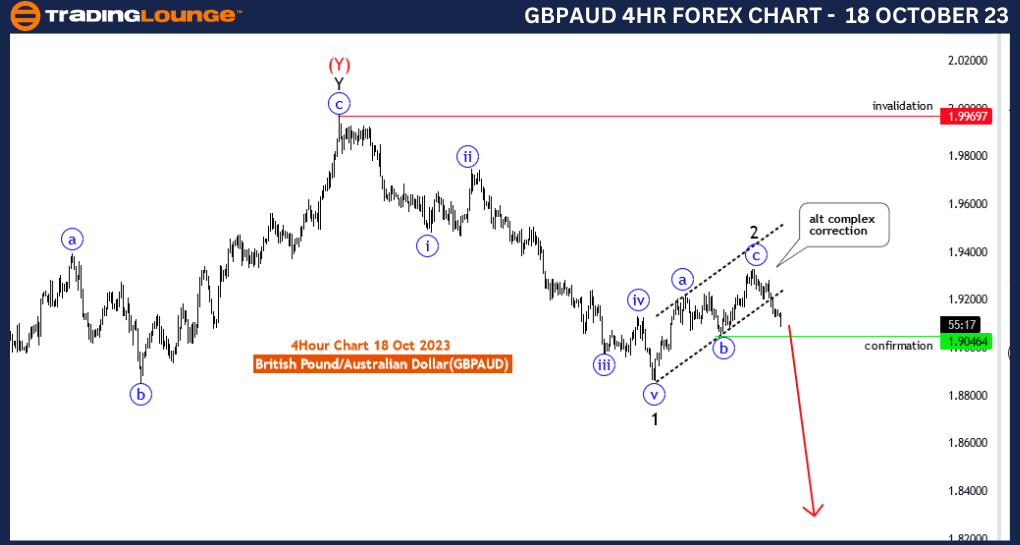
GBPAUD Elliott Wave Analysis Trading Lounge 4 Hour Chart, 18 October 23
Pound/ Australian Dollar(GBPAUD) 4 Hour Chart
GBPAUD Elliott Wave Technical Analysis
Function: Trend
Mode: impulsive
Structure: subwaves of black wave 3
Position: black wave 3
Direction Next lower Degrees:black wave 3 (started)
Details: blue wave C of wave 2 may be completed at 1.93310 .Now looking for wave 3 . Wave Cancel invalid level: 1.99697
The GBPAUD Elliott Wave Analysis for the 4-hour chart on 18 October 23, provides a detailed examination of the British Pound/Australian Dollar (GBPAUD) currency pair's market dynamics. Employing Elliott Wave theory, this analysis offers insights into the prevailing trends and price movements, allowing traders and investors to make informed decisions.
The analysis categorizes the market function as trending, indicative of a persistent price direction. This aligns with impulsive mode, signifying substantial and sustained price movements. An impulsive mode often denotes a strong trend, suggesting lucrative trading opportunities.
The primary focus of this analysis is on "sub waves of black wave 3," highlighting the ongoing trend and its significance within the market's broader structure. In Elliott Wave theory, black wave 3 is generally associated with powerful and extended price movements, which can be of considerable interest to traders.
The key wave of interest is "black wave 3," signifying the current market trend. This wave's initiation, denoted as "black wave 3 (started)," underscores the beginning of a potentially robust and sustained upward movement in the GBPAUD market.
A notable feature is the observation that "blue wave C of wave 2 may be completed at 1.93310." This suggests the possible end of a corrective phase and paves the way for the market to transition into the next phase, "wave 3."
The analysis introduces a critical reference point, the "Wave Cancel invalid level" located at 1.99697. This level serves as an essential guide for traders, assisting them in making informed trading decisions and managing potential risks.
In summary, the GBPAUD Elliott Wave Analysis for 18 October 23, delivers vital insights for traders and investors engaged in the GBPAUD market. It confirms the presence of a strong upward trend, "sub waves of black wave 3," and underscores the initiation of this trend after the possible completion of a correction phase, "blue wave C of wave 2." Traders and investors are advised to pay close attention to the levels indicated in this analysis as they formulate their trading strategies within the GBPAUD currency pair.
Technical Analyst: Malik Awais
Source: Tradinglounge.com get trial here!
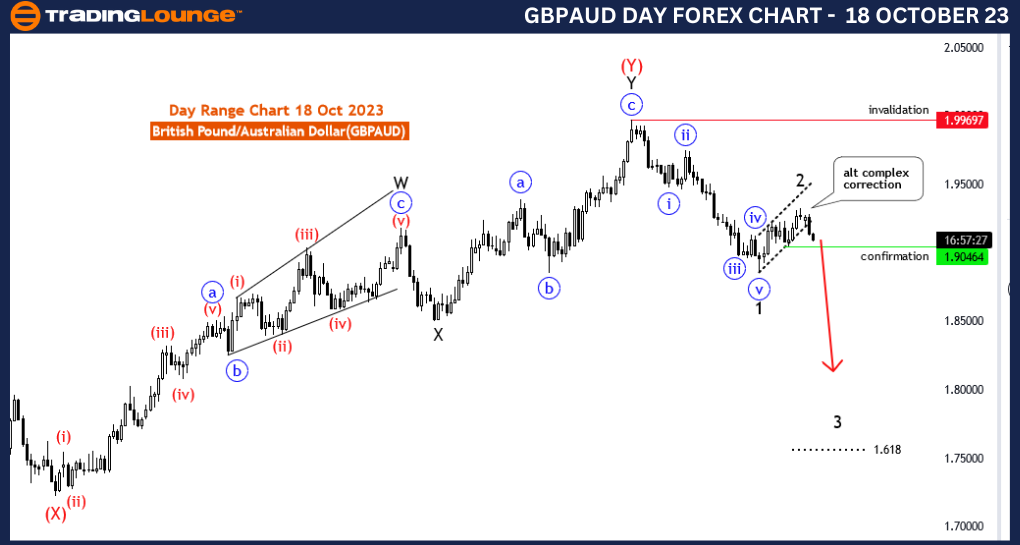
GBPAUD Elliott Wave Analysis Trading Lounge Day Chart, 18 October 23
British Pound/ Australian Dollar(GBPAUD) Day Chart
GBPAUD Elliott Wave Technical Analysis
Function: Trend
Mode: impulsive
Structure: sub waves of black wave 3
Position: black wave 3
Direction Next lower Degrees:black wave 3 (started)
Details: Black wave 2 may be completed at 1.93310 .Now looking for wave 3 . Wave Cancel invalid level: 1.99697
The GBPAUD Elliott Wave Analysis for the day chart on 18 October 23, offers a comprehensive evaluation of the British Pound/Australian Dollar (GBPAUD) currency pair's market behavior using Elliott Wave theory. This analysis is a valuable resource for traders and investors seeking to gain insights into market trends and price movements, enabling them to make informed trading decisions.
The analysis classifies the market's function as trending, which means that a significant and sustained price movement is in progress. This aligns with an impulsive mode, indicating that substantial and consistent price changes are taking place. Impulsive modes are often associated with strong and lasting trends, suggesting favorable trading opportunities.
The primary focus of this analysis is on the "sub waves of black wave 3," emphasizing the current trend and its significance within the market's broader structure. According to Elliott Wave theory, black wave 3 typically represents robust and extended price movements, which are of particular interest to traders.
The central wave of interest is "black wave 3," indicating the prevailing market trend. The notation "black wave 3 (started)" underscores the initiation of a potentially powerful and sustained upward movement in the GBPAUD market.
Notably, the analysis highlights that "Black wave 2 may be completed at 1.93310." This suggests the potential conclusion of a corrective phase and prepares the market for the transition into the next phase, "wave 3."
The analysis introduces a crucial reference point, the "Wave Cancel invalid level," situated at 1.99697. This level serves as a pivotal guide for traders, aiding them in making well-informed trading decisions and managing potential risks.
In summary, the GBPAUD Elliott Wave Analysis for 18 October 23, delivers essential insights for traders and investors operating within the GBPAUD market. It confirms the presence of a robust upward trend, "sub waves of black wave 3," and underscores the commencement of this trend following the potential completion of a corrective phase, "black wave 2." Traders and investors are advised to closely monitor the levels indicated in this analysis as they develop their trading strategies in the GBPAUD currency pair.
Technical Analyst: Malik Awais
Source: Tradinglounge.com get trial here!