Avery Dennison Corp. (AVY) Elliott Wave Technical Analysis - Trading Lounge Daily Chart Analysis
AVY Elliott Wave Analysis
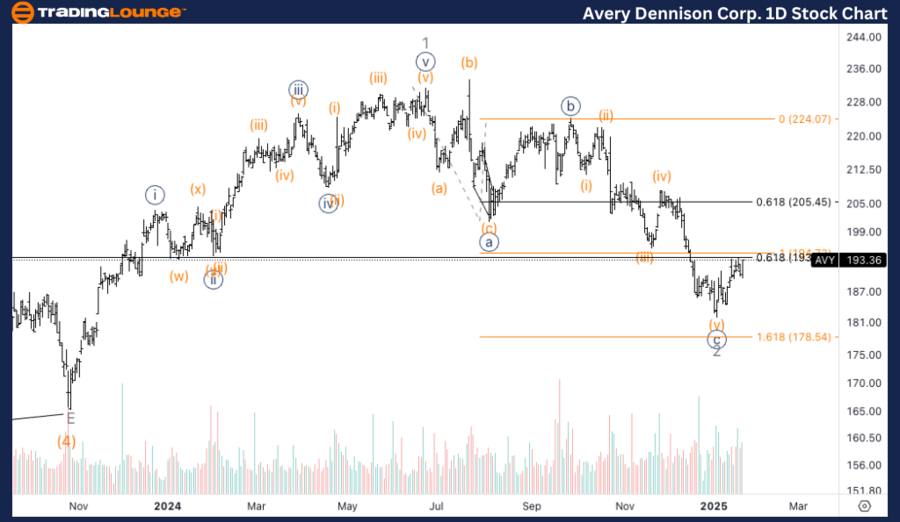
Function: Counter-Trend
Mode: Corrective
Structure: Flat
Position: Wave 2 of (5)
Direction: Potential bottom in wave 2
Details:
The stock has exceeded the equality of {c} vs {a} and is now revisiting this level with growing volume. A potential bottom formation may occur, particularly if the price reclaims the crucial $200 resistance level.
Avery Dennison Corp. (AVY) Elliott Wave Technical Analysis - Trading Lounge 1-Hour Chart Analysis
AVY Elliott Wave Analysis
Function: Counter-Trend
Mode: Corrective
Structure: Flat
Position: Wave (iii) of {i}
Direction: Upside expected in wave {i}
Details:
The outlook for a continued upward move remains strong, with the expectation of a sharp rally in the coming days. A successful retest above Trading Level 2 at $200 would further reinforce bullish sentiment.
Technical Analyst: Alessio Barretta
Source: visit Tradinglounge.com and learn From the Experts Join TradingLounge Here
See Previous: Lululemon athletica Inc. (LULU) Elliott Wave Technical Analysis
VALUE Offer - Buy 1 Month & Get 3 Months!Click here
Access 7 Analysts Over 200 Markets Covered. Chat Room With Support
Summary
The Elliott Wave analysis of Avery Dennison Corp. (AVY) offers valuable insights into market behavior across multiple time frames. The daily chart indicates the potential for a bottoming phase, while the 1-hour chart points to a likely upward movement, contingent on holding key support levels. Monitoring the critical $200 zone remains essential for confirming bullish momentum.