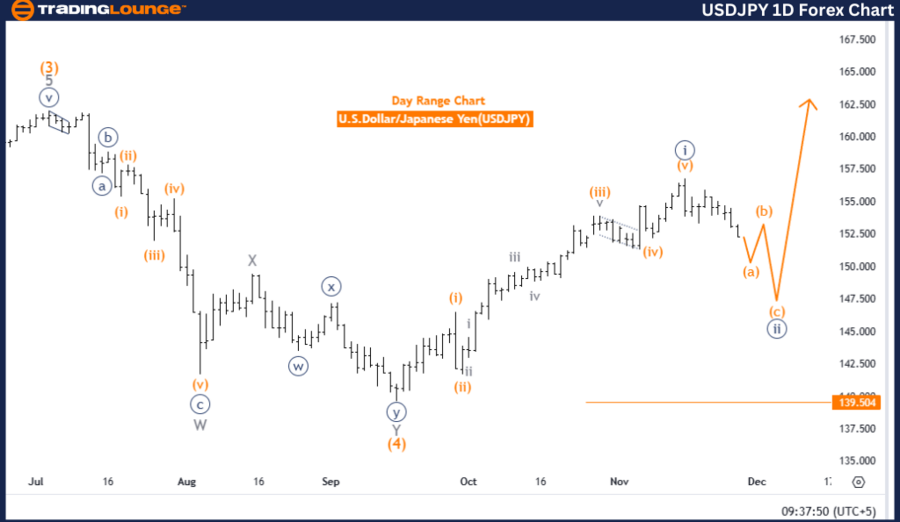
USDJPY Elliott Wave Analysis: Trading Lounge Day Chart
U.S. Dollar / Japanese Yen (USDJPY) – Day Chart
USDJPY Elliott Wave Technical Analysis
Function: Counter Trend
Mode: Corrective
Structure: Navy Blue Wave 2
Position: Gray Wave 1
Direction (Next Higher Degree): Navy Blue Wave 3
Details
- Navy Blue Wave 1 has completed, activating Navy Blue Wave 2.
Wave Cancel Invalidation Level: 139.504
U.S. Dollar / Japanese Yen Analysis Summary
This technical analysis explores the USD/JPY currency pair using Elliott Wave theory applied to the daily chart. The current phase signifies a counter-trend movement categorized as corrective within the broader market context.
Key Observations
-
Primary Structure:
Navy blue wave 2 emerged after completing navy blue wave 1, highlighting the ongoing corrective cycle within the trend.
-
Current Position:
The market currently develops gray wave 1 as part of navy blue wave 2, marking an early stage in the corrective process. The structure indicates potential for additional development before transitioning into navy blue wave 3, an impulsive upward movement.
-
Invalidation Level:
The critical invalidation price of 139.504 serves as the threshold for confirming or negating the present wave count. Falling to this level invalidates the corrective structure, warranting a re-evaluation.
Conclusion
The USDJPY analysis suggests the currency pair is navigating a counter-trend corrective phase. Navy blue wave 2 is actively unfolding, with gray wave 1 currently in progress. The outlook for continued corrective activity remains valid as long as the price holds above 139.504.
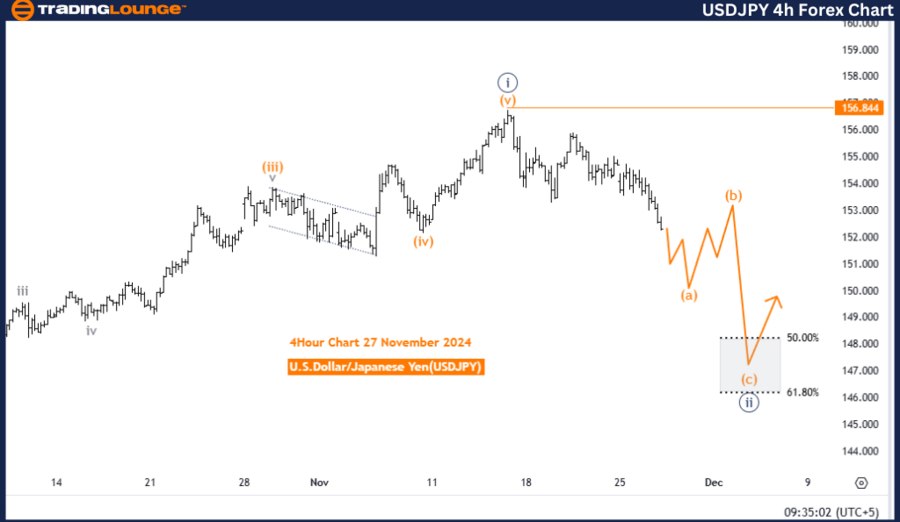
U.S. Dollar / Japanese Yen (USDJPY) – 4-Hour Chart
USDJPY Elliott Wave Technical Analysis
Function: Counter Trend
Mode: Corrective
Structure: Orange Wave A
Position: Navy Blue Wave 2
Direction (Next Higher Degree): Orange Wave B
Details
- Navy blue wave 1 appears completed, and orange wave A within navy blue wave 2 is now active.
Wave Cancel Invalidation Level: 156.844
U.S. Dollar / Japanese Yen Analysis Summary
This segment evaluates the USD/JPY pair with Elliott Wave theory focused on a 4-hour chart. The market is currently in a counter-trend corrective phase, within a broader trend structure.
Key Observations
-
Primary Structure:
Navy blue wave 2 began after the completion of navy blue wave 1. Within this structure, orange wave A represents the initial segment of the corrective movement.
-
Current Position:
The market is presently advancing through orange wave A of navy blue wave 2, marking the early corrective stage. Continued wave development is expected before completing navy blue wave 2.
-
Next Phase:
After orange wave A, the wave structure transitions into orange wave B, completing navy blue wave 2 and setting the stage for the next trend.
-
Invalidation Level:
An invalidation level of 156.844 confirms or negates the current wave count. Breaching this level would invalidate the corrective outlook and require a revised structure analysis.
Conclusion
The USDJPY Elliott Wave analysis highlights a counter-trend corrective movement, with orange wave A actively progressing within navy blue wave 2. The corrective structure remains valid as long as the price stays below 156.844. The anticipated transition to orange wave B will mark the final phase of navy blue wave 2, concluding the correction.
Technical Analyst: Malik Awais
Source: visit Tradinglounge.com and learn From the Experts Join TradingLounge Here
Previous: USDCHF Elliott Wave Technical Analysis
VALUE Offer - Buy 1 Month & Get 3 Months!Click here
Access 7 Analysts Over 200 Markets Covered. Chat Room With Support