MCD Elliott Wave Analysis: McDonald's Corp. (MCD)

In this Elliott Wave analysis of McDonald's Corp. (MCD), we examine its price movement and wave structure using Elliott Wave Theory to identify potential trading opportunities. Both the daily and 1-hour charts are reviewed to offer traders a comprehensive perspective.

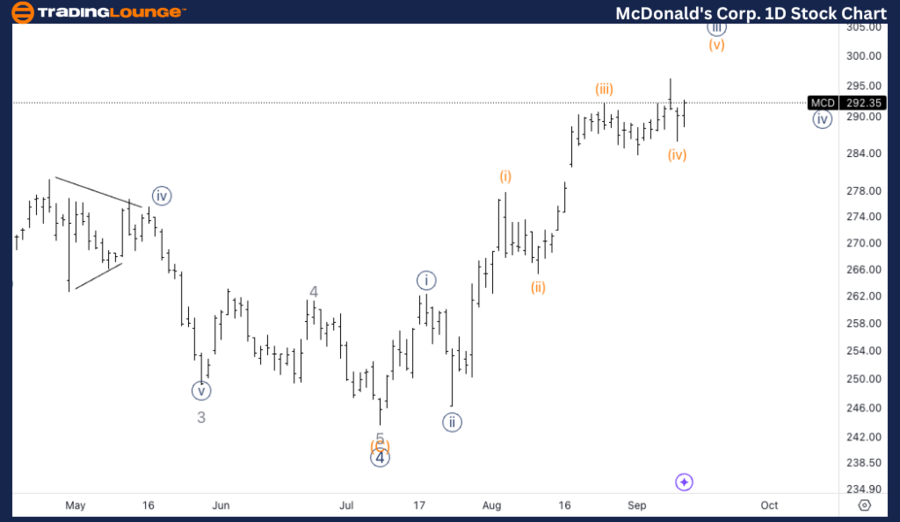
TradingLounge McDonald's Corp. Stock Elliott Wave Analysis – Daily Chart

McDonald's Corp. (MCD) Daily Chart Analysis

MCD Elliott Wave Technical Analysis

Function: Trend

Mode: Impulsive

Structure: Motive

Position: Wave {iii} of 1

Direction: Upside into wave 1

Details: The current price action is moving towards completing a five-wave structure within wave 1, with the stock approaching the key TradingLevel3 at $300.

MCD Stock Technical Analysis – Daily Chart Overview

In the daily chart, McDonald's is displaying a strong impulsive trend, advancing within Wave {iii} of 1. This wave signifies robust upward momentum, with the stock nearing the critical resistance level at $300, recognized as TradingLevel3 (TL3). A five-wave structure within this wave 1 is expected to complete as the price approaches this key level, indicating a significant trading opportunity for upside potential.

McDonalds-Corp-1D-St...


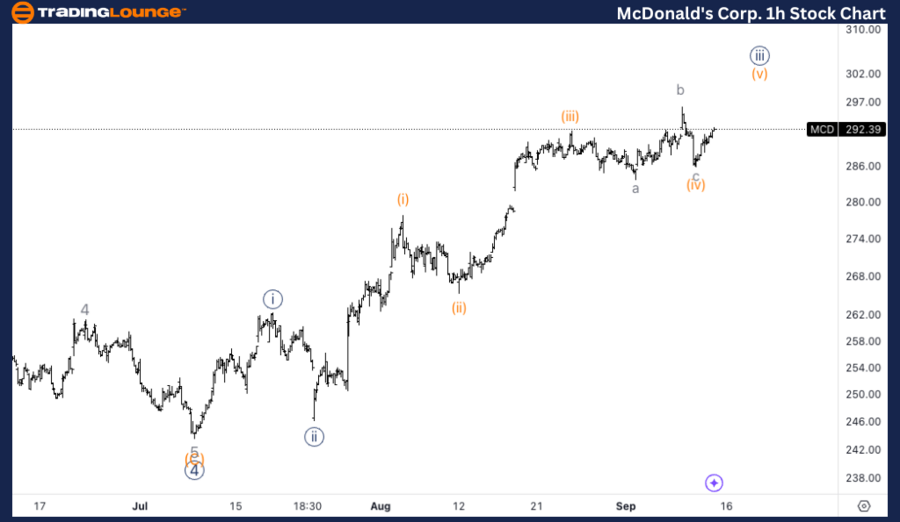
MCD Elliott Wave Analysis – 1H Chart

McDonald's Corp. (MCD) 1H Chart

McDonald's Corp MCD Stock Analysis

Function: Trend

Mode: Impulsive

Structure: Motive

Position: Wave i of (v)

Direction: Upside into wave (v)

Details: The price action suggests an upward move into Wave (v) after a flat correction in Wave (iv), with support found near $280, at the end of MinorGroup2.

MCD Elliott Wave Technical Analysis – 1H Chart Overview

On the 1-hour chart, McDonald's seems to be progressing within Wave i of (v), which likely signals the beginning of the final leg in this impulsive sequence. The recent Wave (iv) formed a flat correction, and the stock found crucial support near $280, aligning with the end of MinorGroup2. This suggests further upward movement is expected in the next wave as the stock continues to build momentum.

Technical Analyst: Alessio Barretta

Source: visit Tradinglounge.com and learn From the Experts Join TradingLounge Here 

See Previous: Deere & Co. (DE) Elliott Wave Technical Analysis

Special Trial Offer - 0.76 Cents a Day for 3 Months! Click here

Access 7 Analysts Over 200 Markets Covered. Chat Room With Support

McDonalds-Corp-1h-St...

Related

Cocoa Price Forecast Using Elliott Wave: Bearish Wave C Projection and Long-Term Bullish Trend for Cocoa Futures Traders

Cocoa Price Forecast Using Elliott Wave: Bearish Wave C Projection and Long-Term Bullish Trend for Cocoa Futures Traders

This analysis provides a complete Elliott Wave forecast of Cocoa futures, including daily and 4H cha...

Read More >
CAC 40 (France) Elliott Wave Analysis: Bullish Trend, Trading Strategy, Price Movement, Wave Structure & Key Support Levels

CAC 40 (France) Elliott Wave Analysis: Bullish Trend, Trading Strategy, Price Movement, Wave Structure & Key Support Levels

CAC 40 Elliott Wave Analysis provides a detailed technical breakdown of the French stock market inde...

Read More >
Detailed USDCAD Elliott Wave Analysis: Chart Insights, Corrective and Impulsive Waves, Forex Strategies, and Predictions

Detailed USDCAD Elliott Wave Analysis: Chart Insights, Corrective and Impulsive Waves, Forex Strategies, and Predictions

This article offers a comprehensive USDCAD Elliott Wave Analysis, covering both day and 4-hour chart...

Read More >
Accurate Dogecoin Crypto Price Technical Analysis and Forecast your next Trade Effectively: DOGEUSD Elliott Wave Analysis

Accurate Dogecoin Crypto Price Technical Analysis and Forecast your next Trade Effectively: DOGEUSD Elliott Wave Analysis

In this comprehensive analysis of Dogecoin (DOGEUSD) using Elliott Wave theory, we provide insights ...

Read More >
Adani Green Energy Elliott Wave Analysis: Stock Forecast, Price Prediction, Technical Trends & Trading Strategy

Adani Green Energy Elliott Wave Analysis: Stock Forecast, Price Prediction, Technical Trends & Trading Strategy

Elliott Wave structure of Adani Green Energy stock, highlighting its corrective wave movement and ke...

Read More >
Elliott Wave analysis of Commonwealth Bank of Australia (CBA) Stock Provides Insights into the Current Market trends on the ASX

Elliott Wave analysis of Commonwealth Bank of Australia (CBA) Stock Provides Insights into the Current Market trends on the ASX

This comprehensive Elliott Wave analysis of Commonwealth Bank of Australia (CBA) stock provides insi...

Read More >

$1 for 2 Weeks

then $29 a month!

What a Special Offer!

Trade Recommendations

Unleash the power of deversified trading with our comprehensive portfolio, covering 250+ markets:

  • Stock Trades
  • Crypto Trades
  • Forex Trades
  • Commodity Trades
Elliott Wave Analysis

Gain a competitive edge with expert insights and AI-powered Elliott Wave charting into:

  • Global Indices
  • US Stocks & ASX Stocks
  • Forex & Crypto
  • Commodities
Top-Notch Trading Tools

Equip yourself with the tools of success:

  • Real-time Chat rooms
  • Elliott Wave Algorithm
  • Portfolio tools
  • TradingLevels
  • Screener
  • Trading Game
7 Elliott Wave Analysts

Stay ahead of the market with daily charts and insightful videos
Your secret to strategic trading!

JOIN HERE


Welcome to TradingLounge (ASIC A.R.No. 321187), specialists in trades, trading education and technical analysis, covering stocks, indices, commodities, forex and cryptocurrencies.

When you join TradingLounge you have access to everything we offer, including trade tools, educational content and a social platform to chat with like-minded investors.

Read more

@Copyright 2024 by tradinglounge.com

Contact Us

Australian no: 02 4787 6020

International no: +61 (2) 47876020

Pay with:

Find us on