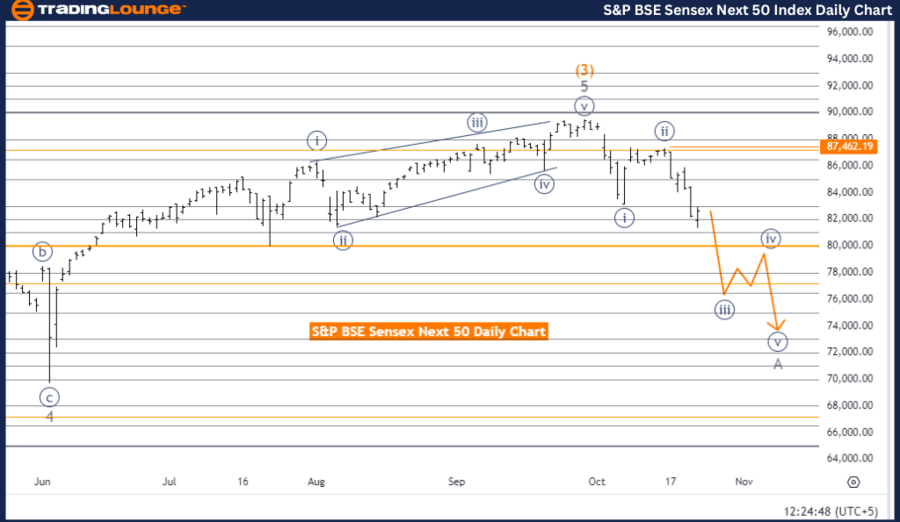
S&P BSE Sensex (India) Elliott Wave Analysis – Day Chart

S&P BSE Sensex (India) Elliott Wave Technical Analysis

  • Function: Counter Trend

  • Mode: Impulsive

  • Structure: Navy Blue Wave 3

  • Position: Gray wave A

  • Direction Next Higher Degrees: Navy blue wave 4

  • Details: Navy Blue Wave 2 has completed, and Navy Blue Wave 3 is in progress. The wave invalidation level stands at 81,462.19.

Key Analysis:

The S&P BSE Sensex daily chart highlights a counter-trend movement within an impulsive mode. The primary wave structure is navy blue wave 3, with gray wave A forming the initial phase of this wave. This suggests a strong downward movement within the broader corrective phase of navy blue wave 3, signaling a potential bearish market sentiment.

Navy blue wave 2 has concluded, and navy blue wave 3 is actively unfolding. This typically signifies an impulsive downward movement within the overall corrective pattern. The market is expected to maintain this downward momentum as gray wave A continues to progress.

The current focus is on gray wave A within navy blue wave 3, which marks the initial phase of the structure. As gray wave A concludes, the next sequence in the wave will continue the downward momentum within navy blue wave 3. Traders should closely monitor the market behavior as this wave unfolds and approaches completion.

The invalidation level for this wave structure is 81,462.19. If the market breaches this level, the existing wave count will be invalidated, necessitating a reevaluation of the current Elliott Wave structure.

Summary:

  • Wave Structure: Navy blue wave 3 is progressing after the completion of navy blue wave 2.

  • Market Movement: Downward impulsive movement within gray wave A.

Invalidation Level: 81,462.19.

S&P-BSE-Sensex-Next-...


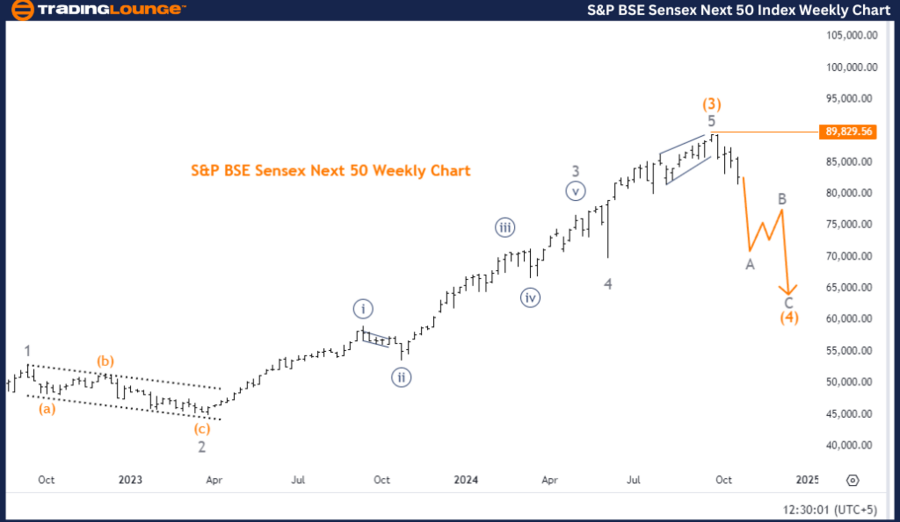
S&P BSE Sensex (India) Elliott Wave Analysis – Weekly Chart

S&P BSE Sensex (India) Elliott Wave Technical Analysis

  • Function: Counter Trend

  • Mode: Corrective

  • Structure: Gray wave A

  • Position: Orange wave 4

  • Direction Next Higher Degrees: Gray wave B

  • Details: Orange Wave 3 is complete, and Wave A of orange wave 4 is in progress. The wave

invalidation level is 89,829.56.

Key Analysis:

The S&P BSE Sensex weekly chart reveals a counter-trend correction, indicating a retracement within the broader upward trend. The current wave structure under observation is gray wave A, which is unfolding within orange wave 4.

Orange wave 3 has concluded, marking the end of a significant upward movement. The market is now in a corrective phase, with wave A of orange wave 4 currently developing. This phase represents a temporary reversal or consolidation within the broader bullish trend. Once wave A of orange wave 4 completes, the market will transition into the next corrective phase, leading into gray wave B.

This consolidation period is typical in corrective wave structures, where the market pauses to absorb previous gains before resuming the upward trend. Traders should focus on gray wave B, which is the next higher-degree wave expected to lead the market into its next significant movement.

The invalidation level for the current wave structure is set at 89,829.56. A breach of this level will require a reassessment of the current Elliott Wave structure.

Summary:

  • Wave Structure: Gray wave A is progressing within orange wave 4.

  • Market Movement: Corrective phase with consolidation expected before transitioning to gray wave B.

Invalidation Level: 89,829.56.

Technical Analyst: Malik Awais

Source: visit Tradinglounge.com and learn From the Experts Join TradingLounge Here 

Previous: Shanghai Composite Elliott Wave Technical Analysis

VALUE Offer - Buy 1 Month & Get 3 Months!Click here

Access 7 Analysts Over 200 Markets Covered. Chat Room With Support

S&P-BSE-Sensex-Next-...

Related

Master Euro Stoxx 50 Trading: Expert Euro Stoxx 50 Index Elliott Wave Technical Analysis, Top Stock Picks & Winning Strategies

Master Euro Stoxx 50 Trading: Expert Euro Stoxx 50 Index Elliott Wave Technical Analysis, Top Stock Picks & Winning Strategies

This article provides a detailed Elliott Wave analysis of the Euro Stoxx 50, offering valuable insig...

Read More >
AUDUSD Elliott Wave Analysis: In-Depth Insights on 4-Hour and Day Charts - February 6, 2024

AUDUSD Elliott Wave Analysis: In-Depth Insights on 4-Hour and Day Charts - February 6, 2024

This detailed analysis delves into the AUDUSD currency pair's Elliott Wave patterns, examining b...

Read More >
New Zealand Dollar/U.S.Dollar (NZDUSD) Elliott Wave Technical Analysis 12 January 24

New Zealand Dollar/U.S.Dollar (NZDUSD) Elliott Wave Technical Analysis 12 January 24

NZDUSD Elliott Wave Analysis for the daily chart on 12 January 24, suggests that the market is curre...

Read More >
Elliott Wave Trading Strategies: Top Market Analysis for SP500, NASDAQ & Tech Stocks

Elliott Wave Trading Strategies: Top Market Analysis for SP500, NASDAQ & Tech Stocks

Expert Elliott Wave analysis is provided for top markets including the SP500, NASDAQ 100, major tech...

Read More >
Invest in Hang Seng Stocks, Explore the Best Options, and Stay Informed: Hang Seng Index Elliott Wave Technical Analysis

Invest in Hang Seng Stocks, Explore the Best Options, and Stay Informed: Hang Seng Index Elliott Wave Technical Analysis

The Hang Seng Index is a pivotal focus for investors seeking to navigate the complexities of the Hon...

Read More >
Amazon Elliott Wave Forecast Shows Strong Bullish Momentum in Daily and Hourly Charts with Accurate Wave Count Predictions

Amazon Elliott Wave Forecast Shows Strong Bullish Momentum in Daily and Hourly Charts with Accurate Wave Count Predictions

This Elliott Wave analysis of AMZN outlines bullish trends in both daily and 1-hour charts, forecast...

Read More >

$1 for 2 Weeks

then $29 a month!

What a Special Offer!

Trade Recommendations

Unleash the power of deversified trading with our comprehensive portfolio, covering 250+ markets:

  • Stock Trades
  • Crypto Trades
  • Forex Trades
  • Commodity Trades
Elliott Wave Analysis

Gain a competitive edge with expert insights and AI-powered Elliott Wave charting into:

  • Global Indices
  • US Stocks & ASX Stocks
  • Forex & Crypto
  • Commodities
Top-Notch Trading Tools

Equip yourself with the tools of success:

  • Real-time Chat rooms
  • Elliott Wave Algorithm
  • Portfolio tools
  • TradingLevels
  • Screener
  • Trading Game
7 Elliott Wave Analysts

Stay ahead of the market with daily charts and insightful videos
Your secret to strategic trading!

JOIN HERE


Welcome to TradingLounge (ASIC A.R.No. 321187), specialists in trades, trading education and technical analysis, covering stocks, indices, commodities, forex and cryptocurrencies.

When you join TradingLounge you have access to everything we offer, including trade tools, educational content and a social platform to chat with like-minded investors.

Read more

@Copyright 2024 by tradinglounge.com

Contact Us

Australian no: 02 4787 6020

International no: +61 (2) 47876020

Pay with:

Find us on