22Oct

Shanghai Composite Index Elliott Wave Technical Analysis: Focusing on Corrective Waves, Market Trends, and Future Price Predictions

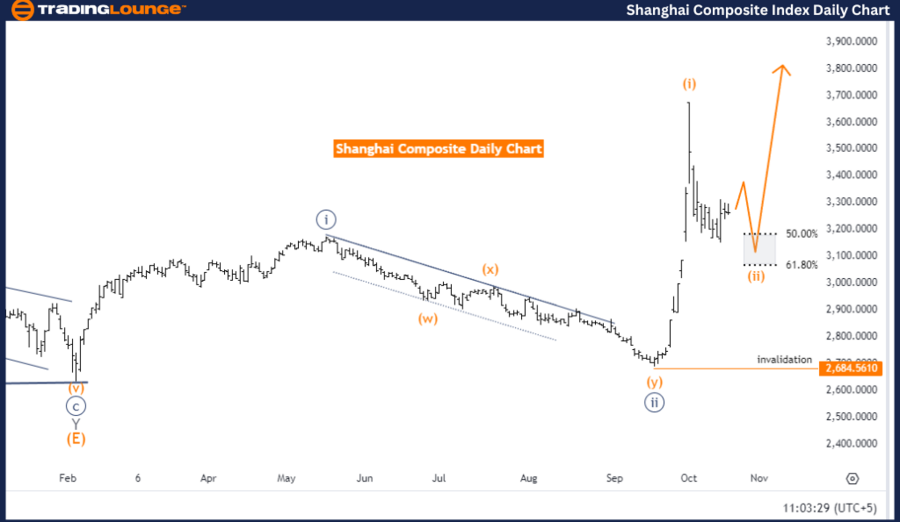
Shanghai Composite Elliott Wave Analysis - Trading Lounge Day Chart

Shanghai Composite Elliott Wave Technical Analysis

Function: Counter Trend

Mode: Corrective

Structure: Orange wave 2

Position: Navy blue wave 3

Next Higher Degree: Orange wave 3

Details: The Elliott Wave analysis for the Shanghai Composite on the daily chart signals a counter-trend phase currently in a corrective mode. The ongoing structure is identified as orange wave 2, following the completion of orange wave 1. The market is positioned within navy blue wave 3, implying that the corrective phase is in progress.

With orange wave 1 completed, orange wave 2 is now developing as a retracement within the overall trend. Once this correction phase concludes, the next expected move will be orange wave 3, resuming the broader upward momentum.

The key focus is on the upcoming orange wave 3, which will likely take place after the completion of the current corrective phase. Price action may experience fluctuations during orange wave 2, as this wave signifies a temporary pullback before the continuation of the main trend.

  • Wave Cancellation Level: 2684.5610 – A price drop below this level would invalidate the current wave count, requiring a reassessment of the wave structure.

Summary: The Shanghai Composite's daily chart is undergoing a corrective phase within orange wave 2, following the completion of orange wave 1. The market's position in navy blue wave 3 suggests that after the correction, an upward movement in orange wave 3 is anticipated. The key level to monitor is 2684.5610; a breach of this level would invalidate the current Elliott Wave count.

Shanghai-Composite-I...


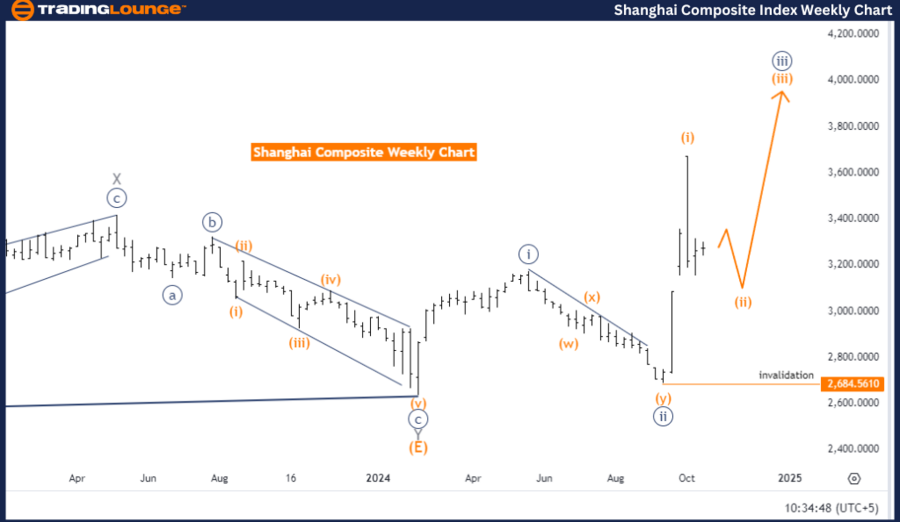
Shanghai Composite Elliott Wave Analysis - Trading Lounge Weekly Chart

Shanghai Composite Elliott Wave Technical Analysis

Function: Counter Trend

Mode: Corrective

Structure: Orange wave 2

Position: Navy Blue Wave 3

Next Higher Degree: Orange wave 3

Details: The Elliott Wave analysis on the weekly chart for the Shanghai Composite reveals a counter-trend correction in progress, with the market moving through orange wave 2, following the end of orange wave 1. This phase represents a temporary retracement within the broader upward trend.

Currently positioned within navy blue wave 3, the market is expected to continue higher once orange wave 2 concludes. The onset of orange wave 3 should resume the upward momentum after this corrective wave completes.

The higher-degree structure points toward the anticipated rise in orange wave 3, which is expected to take place after the current correction in orange wave 2 finishes.

  • Wave Cancellation Level: 2684.5610 – A fall below this level would invalidate the current wave count, requiring a reevaluation.

Summary: The weekly chart of the Shanghai Composite is in a corrective phase within orange wave 2, following the completion of orange wave 1. The market is currently positioned in navy blue wave 3, with an upward movement expected in orange wave 3 once the correction ends. The key level to watch is 2684.5610, as a breach of this level would invalidate the current Elliott Wave count.

Technical Analyst: Malik Awais

Source: visit Tradinglounge.com and learn From the Experts Join TradingLounge Here 

Previous: DOW JONES – DJI Elliott Wave Technical Analysis

VALUE Offer - Buy 1 Month & Get 3 Months!Click here

Access 7 Analysts Over 200 Markets Covered. Chat Room With Support

Shanghai-Composite-I...

Related

NASDAQ Elliott Wave Analysis Reveals Wave C Development in Ongoing Orange Wave 4 Correction with Bullish Forecast Toward Wave 5

NASDAQ Elliott Wave Analysis Reveals Wave C Development in Ongoing Orange Wave 4 Correction with Bullish Forecast Toward Wave 5

NASDAQ index using Elliott Wave Theory. It focuses on the ongoing corrective phase identified as Ora...

Read More >
NEO/ U.S. dollar(NEOUSD) Elliott Wave Technical Analysis 6 December 23

NEO/ U.S. dollar(NEOUSD) Elliott Wave Technical Analysis 6 December 23

NEO/ U.S. dollar(NEOUSD) Elliott Wave Technical Analysis dated 6 December 23, offers an in-depth per...

Read More >
Gold Commodity Price Forecast Using Elliott Wave: 2024 Bullish Trend Points to $3500 Target After Pullback – When to Buy

Gold Commodity Price Forecast Using Elliott Wave: 2024 Bullish Trend Points to $3500 Target After Pullback – When to Buy

Gold remains bullish with Elliott Wave analysis forecasting a rally to $3200–$3500. Discover key le...

Read More >
COAL INDIA Indian Stocks Elliott Wave Technical Analysis: Daily & Weekly Stock Forecast with Key Wave Signals

COAL INDIA Indian Stocks Elliott Wave Technical Analysis: Daily & Weekly Stock Forecast with Key Wave Signals

This article delivers a complete Elliott Wave analysis of COAL INDIA, detailing the stock's corr...

Read More >
JAMES HARDIE INDUSTRIES PLC (JHX) Elliott Wave Analysis: ASX JHX Stock Forecast, Market Trends and Trading Strategy for Investors

JAMES HARDIE INDUSTRIES PLC (JHX) Elliott Wave Analysis: ASX JHX Stock Forecast, Market Trends and Trading Strategy for Investors

JHX Elliott Wave analysis provides a detailed technical forecast for ASX JHX stock. With key price l...

Read More >
Dow Jones Elliott Wave Technical Analysis: Expert Insights on Stock Market Trends, Trading Strategies, and Technical Indicators

Dow Jones Elliott Wave Technical Analysis: Expert Insights on Stock Market Trends, Trading Strategies, and Technical Indicators

Dow Jones Elliott Wave analysis, offers valuable insights into stock market trends, trading strategi...

Read More >

Buy 1 Month

Get 3 Months!

Special Offer:

Trade Recommendations

Unleash the power of deversified trading with our comprehensive portfolio, covering:

  • Stock Trades
  • Crypto Trades
  • Forex Trades
  • Commodity Trades
Elliott Wave Analysis

Gain a competive edge with expert insights in to:

  • Global Indices
  • US Stocks & ASX Stocks
  • Forex & Crypto
  • Commodities
Top-Notch Trading Tools

Equip yourself with the tools of success:

  • Social Chat
  • Elliott Wave Algorithm
  • Screener
  • TradingLevels
  • Trading Game
7 Elliott Wave Analysts

Stay ahead of the market with daily charts and insightful videos
-Your secret to strategic trading!

JOIN HERE


Welcome to TradingLounge (ASIC A.R.No. 321187), specialists in trades, trading education and technical analysis, covering stocks, indices, commodities, forex and cryptocurrencies.

When you join TradingLounge you have access to everything we offer, including trade tools, educational content and a social platform to chat with like-minded investors.

Read more

@Copyright 2024 by tradinglounge.com

Contact Us

Australian no: 02 4787 6020

International no: +61 (2) 47876020

Pay with:

Find us on