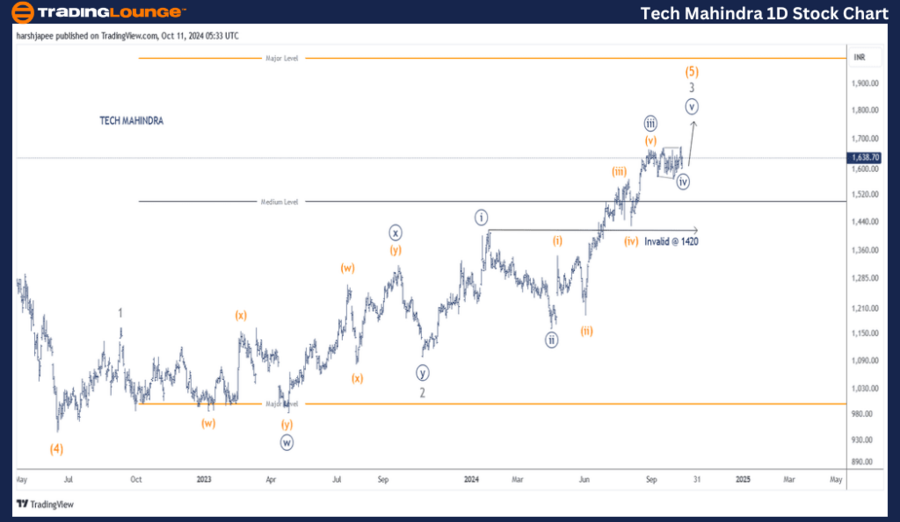
Tech Mahindra – TECHM Elliott Wave Analysis (1D Chart)

TECHM Elliott Wave Technical Analysis

Function: Larger Degree Trend Higher (Intermediate Degree, Orange)

Mode: Motive

Structure: Impulse

Position: Minute Wave ((iv)) Navy

Details: Minute Wave ((iv)) may have completed as a triangle formation near the 1600 mark. If accurate, Minute Wave ((v)) is likely to resume the upward trend soon.

Invalidation Point: 1420

Tech Mahindra Daily Chart Analysis and Elliott Wave Counts:

The daily chart of Tech Mahindra suggests a continuing uptrend, potentially reaching the 1800 levels as Minor Wave 3 Grey progresses. The stock seems poised to resume Minute Wave ((v)) of Minor Wave 3, with prices expected to remain above the 1575 mark.

In June 2022, Tech Mahindra completed Intermediate Wave (4) Orange around the 940 level. Since then, Minor Waves 1 and 2 ended near 1160 and 1105, respectively. Minute Waves ((i)) through ((iv)) of Minor Wave 3 also appear to be completed.

Assuming the wave counts are correct, the stock should rise further towards the 1700-1800 zone as the Minute Wave ((iv)) triangle concludes. Moving forward, prices should stay above the 1420 level, which marked the end of Minute Wave ((i)).

Tech-Mahindra-1D-Sto...


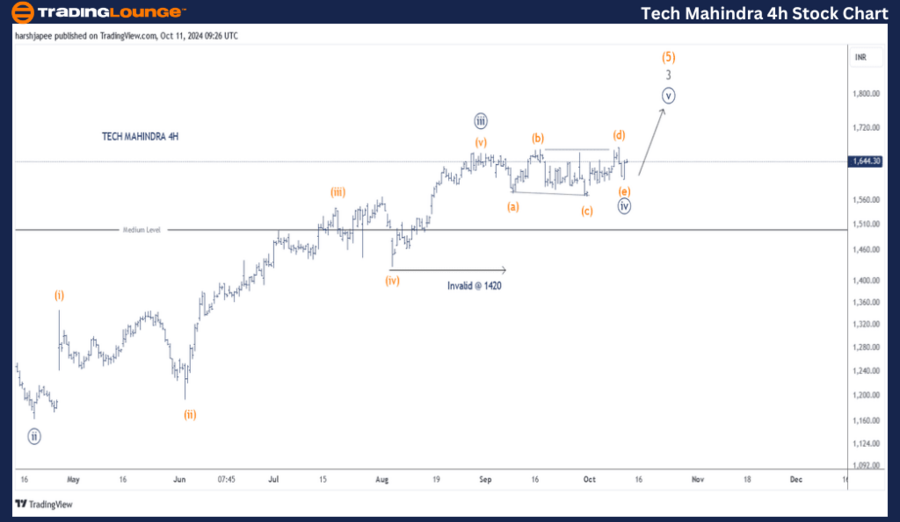
Tech Mahindra – TECHM (4H Chart) Elliott Wave Technical Analysis

Function: Larger Degree Trend Higher (Intermediate Degree, Orange)

Mode: Motive

Structure: Impulse

Position: Minute Wave ((iv)) Navy

Details: Minute Wave ((iv)) might be completed as a triangle near the 1600 mark. If correct, Minute Wave ((v)) of Minor Wave 3 Grey, within Intermediate Wave (5) Orange, is expected to move higher soon.

Invalidation Point: 1420

Tech Mahindra 4H Chart Analysis and Elliott Wave Counts:

The 4H chart of Tech Mahindra reveals the sub-waves forming after Minute Wave ((ii)) of Minor Wave 3. Minute Wave ((iii)) displayed impulsive movement, followed by a potential triangle pattern as Minute Wave ((iv)), likely finishing near 1600. If this is accurate, Minute Wave ((v)) should resume the upward trend shortly.

Technical Analyst: Harsh Japee

Source: visit Tradinglounge.com and learn From the Experts Join TradingLounge Here 

Previous: Sun Pharmaceuticals Elliott Wave Technical Analysis

VALUE Offer - Buy 1 Month & Get 3 Months!Click here

Access 7 Analysts Over 200 Markets Covered. Chat Room With Support

Tech-Mahindra-4h-Sto...


Conclusion:

Tech Mahindra is expected to continue rising within Minute Wave ((v)) of Minor Wave 3 Grey, which falls within Intermediate Wave (5) Orange. The key invalidation level remains at 1420.

Related

Our Detailed Technical Insights of ASX Brambles Limited- BXB Stock Analysis & Elliott Wave Technical Forecast

Our Detailed Technical Insights of ASX Brambles Limited- BXB Stock Analysis & Elliott Wave Technical Forecast

Explore the latest Elliott Wave analysis for BRAMBLES LIMITED (BXB) on the ASX. Our detailed technic...

Read More >
Comprehensive Elliott Wave Analysis: S&P 500, NASDAQ, and Key Indices

Comprehensive Elliott Wave Analysis: S&P 500, NASDAQ, and Key Indices

This comprehensive analysis covers key stock market indices, including the S&P 500, NASDAQ 100, and ...

Read More >
Elliott Wave Market Update: Navigating Corrections and Stability Ahead of Easter

Elliott Wave Market Update: Navigating Corrections and Stability Ahead of Easter

As the Easter holidays approach, the stock market is experiencing a dip in trading volume, leading t...

Read More >
NEO/ U.S. dollar(NEOUSD) Elliott Wave Technical Analysis 6 December 23

NEO/ U.S. dollar(NEOUSD) Elliott Wave Technical Analysis 6 December 23

NEO/ U.S. dollar(NEOUSD) Elliott Wave Technical Analysis dated 6 December 23, offers an in-depth per...

Read More >
ASX Trading Wisetech Global Limited Stock Analysis & WTC Elliott Wave Technical Forecast to Enhance your Trading Strategy

ASX Trading Wisetech Global Limited Stock Analysis & WTC Elliott Wave Technical Forecast to Enhance your Trading Strategy

Stay ahead in the market with our comprehensive Elliott Wave analysis of Wisetech Global Limited (WT...

Read More >
U.S.Dollar /Canadian Dollar(USD/CAD) Elliott Wave Technical Analysis 29 November 23

U.S.Dollar /Canadian Dollar(USD/CAD) Elliott Wave Technical Analysis 29 November 23

USD and CAD Elliott Wave Analysis Trading Lounge Day Chart dated 29 November 23, delves into a detai...

Read More >

Buy 1 Month

Get 3 Months!

Special Offer:

Trade Recommendations

Unleash the power of deversified trading with our comprehensive portfolio, covering:

  • Stock Trades
  • Crypto Trades
  • Forex Trades
  • Commodity Trades
Elliott Wave Analysis

Gain a competive edge with expert insights in to:

  • Global Indices
  • US Stocks & ASX Stocks
  • Forex & Crypto
  • Commodities
Top-Notch Trading Tools

Equip yourself with the tools of success:

  • Social Chat
  • Elliott Wave Algorithm
  • Screener
  • TradingLevels
  • Trading Game
7 Elliott Wave Analysts

Stay ahead of the market with daily charts and insightful videos
-Your secret to strategic trading!

JOIN HERE


Welcome to TradingLounge (ASIC A.R.No. 321187), specialists in trades, trading education and technical analysis, covering stocks, indices, commodities, forex and cryptocurrencies.

When you join TradingLounge you have access to everything we offer, including trade tools, educational content and a social platform to chat with like-minded investors.

Read more

@Copyright 2024 by tradinglounge.com

Contact Us

Australian no: 02 4787 6020

International no: +61 (2) 47876020

Pay with:

Find us on