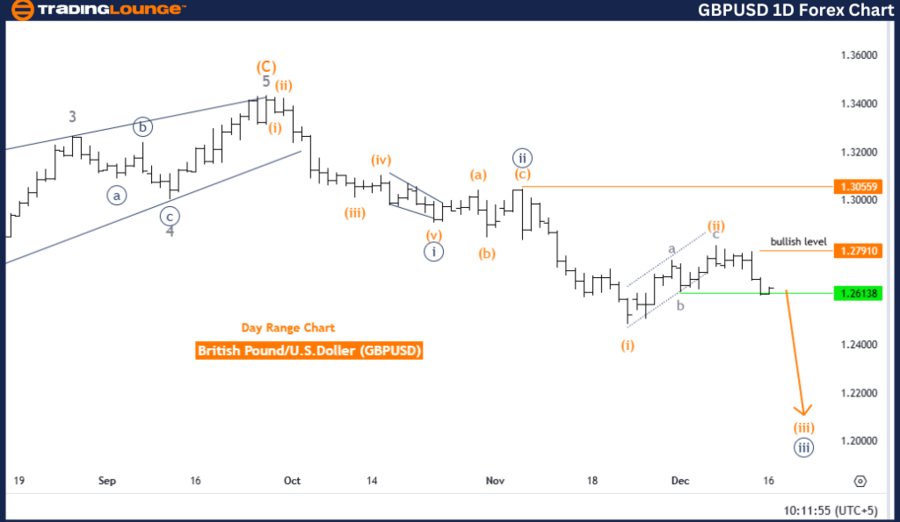
British Pound/ U.S. Dollar (GBPUSD) Elliott Wave Analysis - Trading Lounge Day Chart
GBPUSD Elliott Wave Technical Analysis
Function: Bearish Trend
Mode: Impulsive
Structure: Orange Wave 3
Position: Navy Blue Wave 3
Direction Next Higher Degrees: Orange Wave 4
Details: Orange Wave 2 appears completed; Orange Wave 3 of Navy Blue Wave 3 is in progress.
Wave Cancel Invalidation Level: 1.27910
Analysis Overview
The daily GBPUSD chart underscores a dominant bearish trend based on Elliott Wave principles. The impulsive wave mode highlights strong downward momentum in the market. The current wave structure, Orange Wave 3, is actively unfolding within Navy Blue Wave 3. This aligns with expectations for further price declines, reinforcing the bearish sentiment.
The analysis confirms that Orange Wave 2 has concluded, giving way to Orange Wave 3's development within Navy Blue Wave 3. This phase is typically characterized by increased selling pressure and swift price drops, accentuating the prevailing bearish momentum.
Higher-Degree Structure and Next Steps
Following the completion of Orange Wave 3, the market is expected to transition into Orange Wave 4, aligning with the broader wave cycle. For now, the primary focus remains on the ongoing progression of Orange Wave 3 within Navy Blue Wave 3, which continues to dictate market direction.
Key Levels to Watch
The wave count invalidation level is marked at 1.27910. A price movement above this level would nullify the current Elliott Wave scenario and require a reevaluation of the wave structure. This level serves as a pivotal reference point for trend validation and risk management.
Conclusion
The GBPUSD daily chart indicates a robust bearish trend driven by Orange Wave 3. With Orange Wave 2 completed, the ongoing development of Orange Wave 3 within Navy Blue Wave 3 supports a continued downward trajectory. Traders should adopt a bearish stance while vigilantly monitoring price behavior in relation to the invalidation level (1.27910) to manage risk effectively.
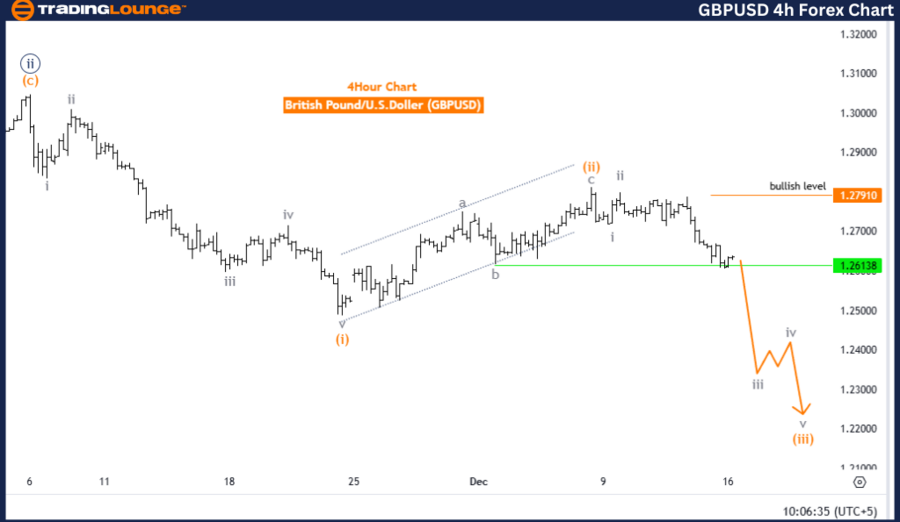
British Pound/ U.S. Dollar (GBPUSD) Elliott Wave Analysis - Trading Lounge 4-Hour Chart
GBPUSD Elliott Wave Technical Analysis
Function: Bearish Trend
Mode: Impulsive
Structure: Gray Wave 3
Position: Orange Wave 3
Direction Next Lower Degrees: Gray Wave 3 (continuing)
Details: Gray Wave 2 appears completed; Gray Wave 3 is in progress.
Wave Cancel Invalidation Level: 1.27910
Analysis Overview
The GBPUSD four-hour chart confirms a bearish trend, backed by Elliott Wave analysis. The wave mode is impulsive, underscoring strong downward pressure. Gray Wave 3, the ongoing wave structure, is actively advancing, bolstering the bearish narrative.
The analysis indicates that Gray Wave 2 has been completed, leading to the unfolding of Gray Wave 3. This wave typically signifies the steepest price drop within the impulsive sequence. Presently, the market is positioned within Orange Wave 3, further amplifying the bearish outlook.
Next Phases and Implications
The continuation of Gray Wave 3 is the next anticipated phase, consistent with the prevailing bearish momentum. This progression aligns with short-trading opportunities and other strategies geared towards benefiting from a declining market trend.
Key Levels to Watch
The invalidation level for the wave structure is 1.27910. Any movement above this threshold would invalidate the current wave count, prompting a reassessment of the Elliott Wave structure. This level is critical for trend validation and risk mitigation.
Conclusion
The GBPUSD four-hour chart highlights a strong bearish trend, with Gray Wave 3 dominating the market direction. The completion of Gray Wave 2 and the ongoing development of Gray Wave 3 underscore persistent downward momentum. Traders are advised to adhere to the bearish outlook and carefully monitor price action around the invalidation level (1.27910) for effective risk management during this phase.
Technical Analyst: Malik Awais
Source: visit Tradinglounge.com and learn From the Experts Join TradingLounge Here
Previous: USDCAD Elliott Wave Technical Analysis
VALUE Offer - Buy 1 Month & Get 3 Months!Click here
Access 7 Analysts Over 200 Markets Covered. Chat Room With Support