This analysis for Costco Wholesale Corp. (COST) highlights the current Elliott Wave structure and potential price movements on both the daily and 1-hour charts. The focus is on identifying the wave positions and key levels that could inform trading strategies.

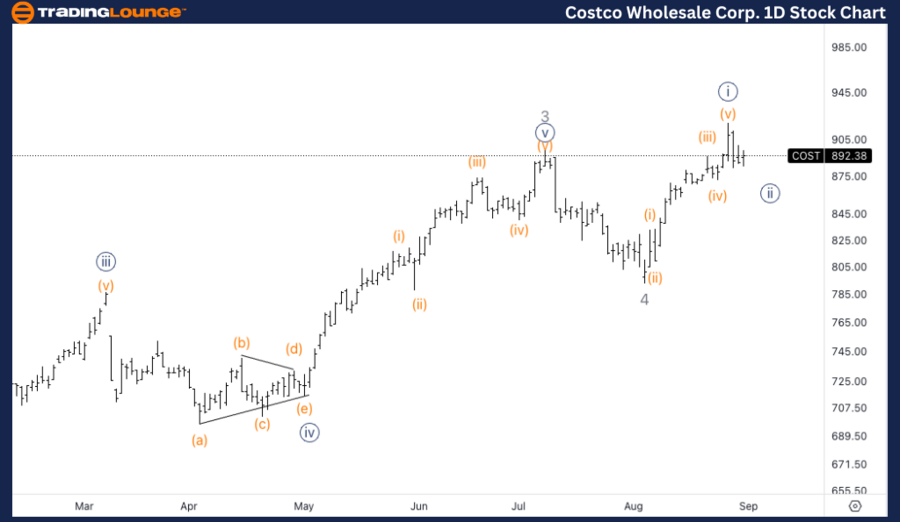
COST Elliott Wave Analysis – Trading Lounge Daily Chart

Costco Wholesale Corp. (COST) Daily Chart

COST Elliott Wave Technical Analysis

Function: Trend

Mode: Impulsive

Structure: Motive

Position: Wave 5

Direction: Upward in Wave 5

Details: Expecting continued upward movement in Wave 5, with the next key TradingLevel around $1000.

COST Elliott Wave Technical Analysis – Daily Chart

COST is currently advancing in its final Wave 5, suggesting the trend is approaching its peak. The next significant resistance is anticipated at the $1000 TradingLevel, which could serve as a target for this wave. Traders should be vigilant for signs of trend exhaustion as the price nears this level, since Wave 5 typically signals the end of an impulsive trend, possibly leading to a larger corrective phase. 

Costco-Wholesale-Cor...


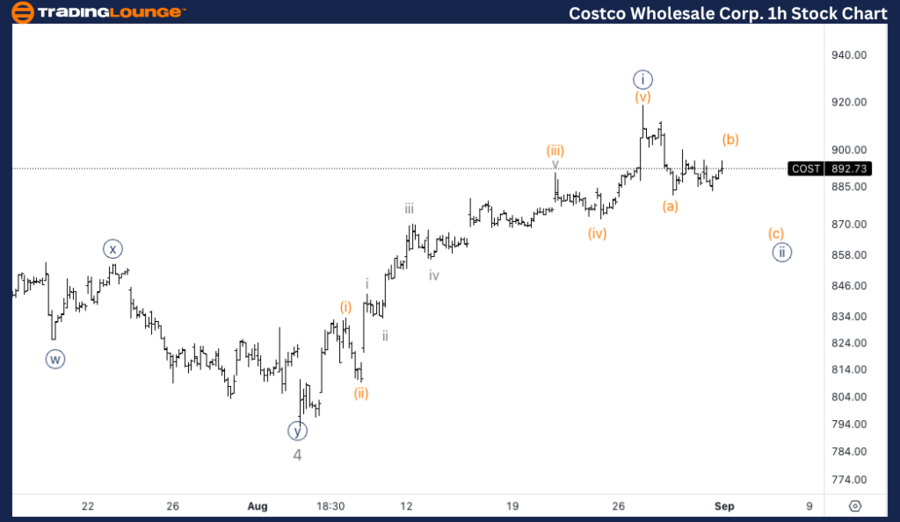
COST Elliott Wave Analysis – Trading Lounge 1H Chart

Costco Wholesale Corp. (COST) 1H Chart

COST Elliott Wave Technical Analysis

Function: Trend

Mode: Impulsive

Structure: Motive

Position: Wave {ii} of 5

Direction: Bottoming in Wave {ii}

Details: Anticipating a potential continuation lower in Wave {ii}, with a possible three-wave correction pattern forming. The MG2 level near $800 is expected to hold as critical support.

COST Elliott Wave Technical Analysis – 1H Chart

On the 1-hour chart, COST appears to be in a corrective Wave {ii} of 5, which may lead to further downside before the uptrend resumes. A potential three-wave corrective pattern is developing, with the MG2 level around $800 acting as a critical support zone. If this support holds, it could signify the completion of Wave {ii} and pave the way for the next impulsive Wave {iii} of 5.

Technical Analyst: Alessio Barretta

Source: visit Tradinglounge.com and learn From the Experts Join TradingLounge Here 

See Previous: META Elliott Wave Technical Analysis

Special Trial Offer - 0.76 Cents a Day for 3 Months! Click here

Access 7 Analysts Over 200 Markets Covered. Chat Room With Support

Costco-Wholesale-Cor...

Related

Silver (XAGUSD) Commodity Elliott Wave Analysis: Key Trading Opportunities and Technical Insights that Could Influence Silver Prices

Silver (XAGUSD) Commodity Elliott Wave Analysis: Key Trading Opportunities and Technical Insights that Could Influence Silver Prices

This article provides an in-depth Silver Elliott Wave analysis with a detailed price forecast for 20...

Read More >
Stay informed with our expert insights: Visa Inc. (V) Stocks Elliott Wave Technical Analysis

Stay informed with our expert insights: Visa Inc. (V) Stocks Elliott Wave Technical Analysis

Get the latest Elliott Wave analysis for Visa Inc. (V) as of June 13, 2024. Our detailed review cove...

Read More >
IBEX 35 (Spain) Index Elliott Wave Technical Analysis: Stay Ahead with the Latest Market Trends and Forecasts

IBEX 35 (Spain) Index Elliott Wave Technical Analysis: Stay Ahead with the Latest Market Trends and Forecasts

This article provides a comprehensive IBEX 35 Elliott Wave Analysis, focusing on Spain's stock m...

Read More >
Insurance Australia Group IAG Elliott Wave Analysis Reveals Key Resistance Targets Before Major Decline | ASX Stock Forecast

Insurance Australia Group IAG Elliott Wave Analysis Reveals Key Resistance Targets Before Major Decline | ASX Stock Forecast

Insurance Australia Group (ASX:IAG) is completing a B-wave and setting up for a decline. Forecasts s...

Read More >
Palo Alto Networks (PANW) Elliott Wave Analysis: Stock Forecast, Bullish Trend, Resistance Levels & Investment Strategy

Palo Alto Networks (PANW) Elliott Wave Analysis: Stock Forecast, Bullish Trend, Resistance Levels & Investment Strategy

Palo Alto Networks Inc. (PANW) is showing strong bullish momentum based on Elliott Wave analysis. Th...

Read More >
SEIUSD Elliott Wave Overview: Daily & H4 Chart Guide – Wave 2 Correction, $0.220 Breakout, Fibonacci Setup, Swing‑Trade Strategy

SEIUSD Elliott Wave Overview: Daily & H4 Chart Guide – Wave 2 Correction, $0.220 Breakout, Fibonacci Setup, Swing‑Trade Strategy

This article provides an in‑depth Elliott Wave analysis for SEI/USD on both Daily and H4 charts. It...

Read More >

$1 for 2 Weeks

then $29 a month!

What a Special Offer!

Trade Recommendations

Unleash the power of deversified trading with our comprehensive portfolio, covering 250+ markets:

  • Stock Trades
  • Crypto Trades
  • Forex Trades
  • Commodity Trades
Elliott Wave Analysis

Gain a competitive edge with expert insights and AI-powered Elliott Wave charting into:

  • Global Indices
  • US Stocks & ASX Stocks
  • Forex & Crypto
  • Commodities
Top-Notch Trading Tools

Equip yourself with the tools of success:

  • Real-time Chat rooms
  • Elliott Wave Algorithm
  • Portfolio tools
  • TradingLevels
  • Screener
  • Trading Game
7 Elliott Wave Analysts

Stay ahead of the market with daily charts and insightful videos
Your secret to strategic trading!

JOIN HERE


Welcome to TradingLounge (ASIC A.R.No. 321187), specialists in trades, trading education and technical analysis, covering stocks, indices, commodities, forex and cryptocurrencies.

When you join TradingLounge you have access to everything we offer, including trade tools, educational content and a social platform to chat with like-minded investors.

Read more

@Copyright 2024 by tradinglounge.com

Contact Us

Australian no: 02 4787 6020

International no: +61 (2) 47876020

Pay with:

Find us on