British Pound / U.S. Dollar (GBPUSD) Elliott Wave Analysis – Trading Lounge Daily Chart Analysis
GBPUSD Elliott Wave Technical Overview
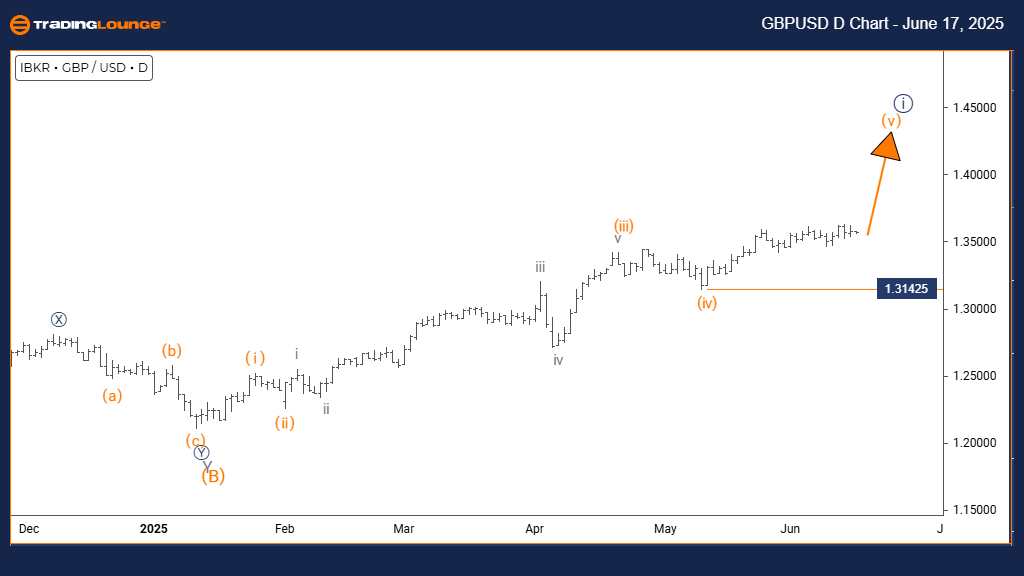
Function: Bullish Price Trend
Wave Mode: Impulsive Pattern
Wave Structure: Orange Wave 5
Current Position: Navy Blue Wave 1
Next Expected Move: Navy Blue Wave 2
Key Detail: Orange Wave 4 has likely completed; Orange Wave 5 is now unfolding. The invalidation threshold is at 1.31425.
Analysis Summary
On the daily GBPUSD chart, a bullish Elliott Wave structure remains active, with impulsive wave patterns supporting ongoing upward momentum. Currently, the market is in orange wave 5, part of the larger navy blue wave 1 formation. This setup indicates that GBPUSD is nearing the end of a multi-leg impulse, which usually precedes a corrective phase.
The completion of orange wave 4 marked the transition to wave 5, which often represents the final leg in a 5-wave impulsive structure. Traders should now focus on the emergence of navy blue wave 2, which is expected to be a corrective wave once wave 5 concludes.
The critical invalidation point remains at 1.31425. A breach below this price would invalidate the present wave count, requiring a reevaluation of the bullish forecast. Until that level is broken, the Elliott Wave model favors continued upward action in GBPUSD.
Conclusion
The GBPUSD currency pair is positioned for potential further strength as orange wave 5 continues. While bullish momentum remains intact, this phase typically marks the end of an impulsive move. Traders should remain alert for reversal patterns and consider risk management strategies as the wave cycle nears completion.
British Pound / U.S. Dollar (GBPUSD) Elliott Wave Analysis – Trading Lounge 4-Hour Chart Analysis
GBPUSD Elliott Wave Technical Overview
Function: Counter-Trend Correction
Wave Mode: Corrective Pattern
Wave Structure: Gray Wave 2
Current Position: Orange Wave 3
Next Expected Move: Gray Wave 3
Key Detail: Gray wave 1 has likely completed; gray wave 2 is in progress. Invalidation level stays at 1.31425.
Analysis Summary
The 4-hour GBPUSD chart shows a corrective structure forming within a broader counter-trend environment. This activity is classified as gray wave 2 inside the larger orange wave 3 impulse. The price pattern currently reflects a standard retracement phase before resuming its prior trend.
With gray wave 1 likely finished, focus now shifts to gray wave 2, which often pulls back a portion of the previous wave’s range. Once this consolidation ends, the expectation is for gray wave 3 to take over, continuing the primary bullish direction.
This pattern implies GBPUSD could oscillate in a tight range or exhibit brief downward corrections. However, the overall bullish setup remains valid above the invalidation level of 1.31425.
Conclusion
GBPUSD is currently undergoing gray wave 2, a corrective phase that fits into a larger bullish trend. Traders should watch closely for signs of completion in this wave, which would signal the beginning of gray wave 3 and a possible continuation of upward price movement.
Technical Analyst: Malik Awais
Source: Visit Tradinglounge.com and learn from the Experts. Join TradingLounge Here
Previous: NZDUSD Elliott Wave Technical Analysis
VALUE Offer - $1 for 2 Weeks then $29 a month!Click here
Access 7 Analysts Over 200 Markets Covered. Chat Room With Support
