U.S. Dollar / Japanese Yen (USDJPY) Elliott Wave Analysis - Trading Lounge Day Chart
USDJPY Elliott Wave Technical Analysis
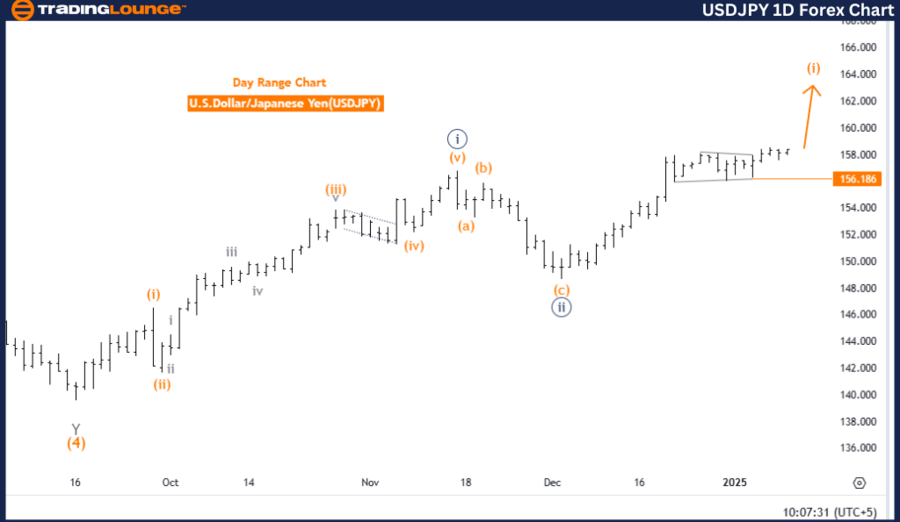
Function: Bullish Trend
Mode: Impulsive
Structure: Orange Wave 1
Position: Navy Blue Wave 3
Direction Next Lower Degrees: Orange Wave 2
Details: Orange wave 1 is still active and nearing completion.
Wave Cancel Invalid Level: 156.186
The USDJPY currency pair showcases a pronounced bullish trend on the daily chart, confirmed by Elliott Wave analysis. The market is currently in an impulsive phase, with orange wave one advancing as part of the larger navy blue wave three structure. This signifies a strong upward momentum within the prevailing trend.
Key Insights
-
Orange Wave 1 Progression:
- Orange wave one reflects robust upward momentum as part of the larger impulsive structure, suggesting strong bullish pressure in the market.
-
Transition to Orange Wave 2:
- Once orange wave one concludes, the next phase, orange wave two, is expected to emerge. This corrective wave will likely serve as a temporary pullback within the overarching bullish trend.
-
Invalidation Level:
- The critical invalidation level is set at 156.186. A break below this level invalidates the current wave count, prompting a reevaluation of the Elliott Wave scenario.
Conclusion
The USDJPY pair remains firmly in a bullish trend, with orange wave one nearing its completion within the broader navy blue wave three structure. A corrective pullback, marked by orange wave two, is anticipated before the resumption of the upward trend. Monitoring the 156.186 invalidation level is essential for confirming the integrity of the current wave count.
This analysis offers valuable insights into the strength and sustainability of the bullish trend, enabling traders to anticipate future price movements effectively.
U.S. Dollar / Japanese Yen (USDJPY) Elliott Wave Analysis - Trading Lounge 4-Hour Chart
USDJPY Elliott Wave Technical Analysis
Function: Bullish Trend
Mode: Impulsive
Structure: Gray Wave 5
Position: Orange Wave 1
Direction Next Lower Degrees: Orange Wave 2
Details: Gray wave four has concluded; gray wave five of orange wave one is in progress.
Wave Cancel Invalid Level: 156.186
On the 4-hour chart, the USDJPY currency pair sustains its bullish momentum, with gray wave five advancing as part of orange wave one. The completion of gray wave four has set the stage for gray wave five, signaling a continuation of the impulsive movement.
Key Insights
-
Gray Wave 5 Progression:
- Gray wave five represents the final leg of the current impulsive sequence, underscoring the strong bullish momentum in the market.
-
Transition to Orange Wave 2:
- After gray wave five concludes, a corrective phase, orange wave two, is anticipated. This phase will provide a natural pullback before the larger upward trend resumes.
-
Invalidation Level:
- The 156.186 price level remains the critical invalidation benchmark. A move below this threshold invalidates the existing wave structure, requiring a revised analysis.
Conclusion
The USDJPY pair continues in a strong bullish impulsive phase, with gray wave five currently advancing within the broader orange wave one framework. As this phase unfolds, the next expected movement is orange wave two, offering a temporary retracement in the bullish trajectory.
Monitoring the 156.186 invalidation level ensures the accuracy of the Elliott Wave count and provides a vital reference point for traders. Observing gray wave five’s progression will offer deeper insights into the market’s momentum and direction.
Technical Analyst: Malik Awais
Source: visit Tradinglounge.com and learn From the Experts Join TradingLounge Here
Previous: EURUSD Elliott Wave Technical Analysis
VALUE Offer - Buy 1 Month & Get 3 Months!Click here
Access 7 Analysts Over 200 Markets Covered. Chat Room With Support