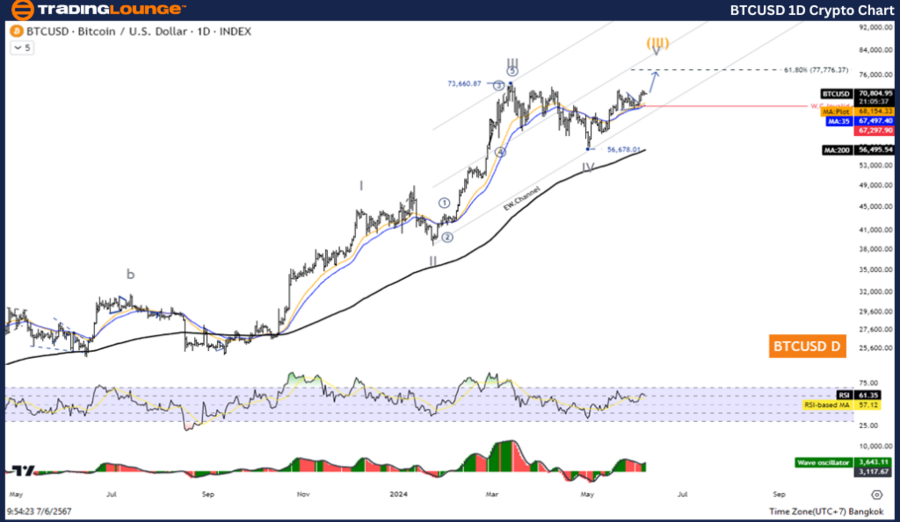
BTCUSD Elliott Wave Analysis TradingLounge Daily Chart
Bitcoin/ U.S. Dollar Daily Chart Analysis
BTCUSD Elliott Wave Technical Analysis
Function: Follow Trend
Mode: Motive
Structure: Impulse
Position: Wave V
Direction Next Higher Degrees: Wave (III)
Wave Cancel Invalid Level:
Details: The price is likely to increase above the level of 73,660.
Bitcoin/ U.S. dollar (BTCUSD) Trading Strategy:
- A five-wave increase in the Impulse pattern, with the fourth wave appearing to be complete.
- The price rose again during the fifth wave.
- The overall picture suggests a rise above the level of 73,660.
Bitcoin/ U.S. dollar (BTCUSD) Technical Indicators:
- The price is below the MA200 indicating an uptrend.
- The Wave Oscillator shows bullish momentum.

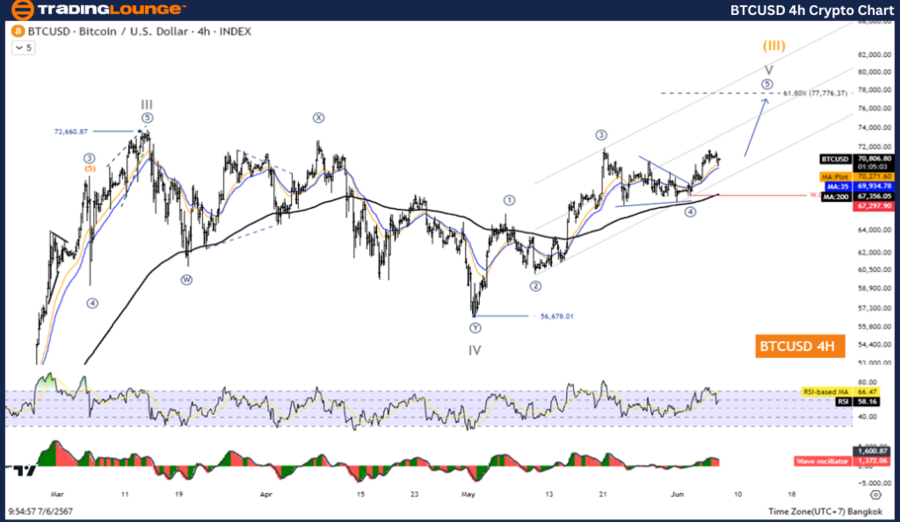
BTCUSD Elliott Wave Analysis TradingLounge 4-Hour Chart
Bitcoin/ U.S. Dollar 4-Hour Chart Analysis
BTCUSD Elliott Wave Technical Analysis
Function: Follow Trend
Mode: Motive
Structure: Impulse
Position: Wave V
Direction Next Higher Degrees: Wave (III)
Wave Cancel Invalid Level:
Details: The price is likely to increase above the level of 73,660.
Bitcoin/ U.S. dollar (BTCUSD) Trading Strategy:
- A five-wave increase in the Impulse pattern, with the fourth wave appearing to be complete.
- The price rose again during the fifth wave.
- The overall picture suggests a rise above the level of 73,660.
Bitcoin/ U.S. dollar (BTCUSD) Technical Indicators:
- The price is below the MA200 indicating an uptrend.
- The Wave Oscillator shows bullish momentum.
Technical Analyst: Kittiampon Somboonsod
Source: visit Tradinglounge.com and learn From the Experts Join TradingLounge Here
See Previous: Dogecoin/ U.S. dollar (DOGEUSD) Elliott Wave Technical Analysis
Special Trial Offer - 0.76 Cents a Day for 3 Months! Click here
Access 7 Analysts Over 170 Markets Covered. Chat Room With Support
