Gold Elliott Wave Technical Analysis – March 2025
Gold is rebounding after a pullback that started in late February, showing signs of a potential breakout above its February high. With the U.S. dollar facing further declines, gold prices could extend their bullish momentum.
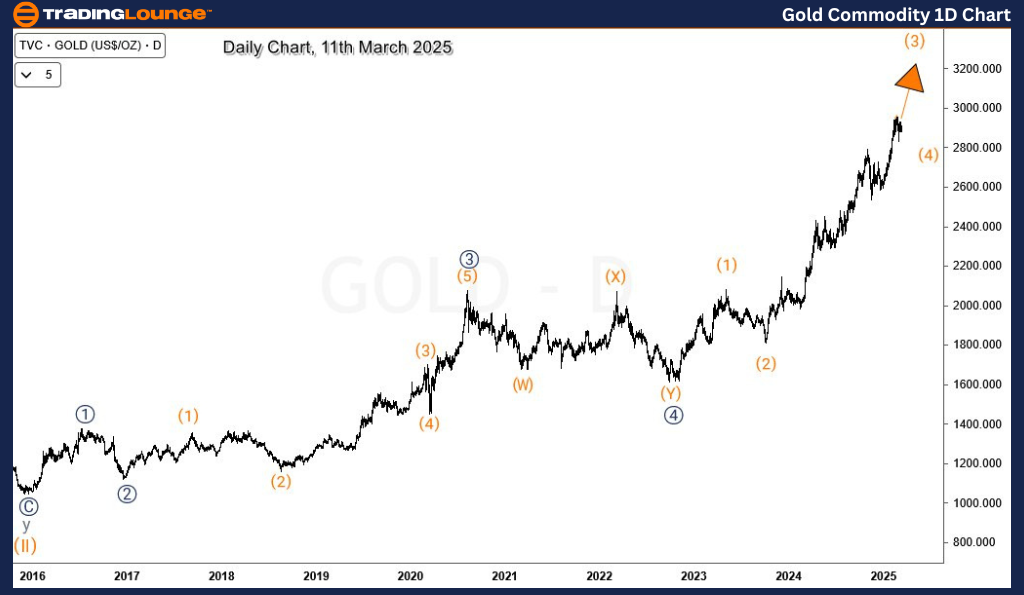
Gold Daily Chart Analysis
Gold remains in a long-term uptrend and has yet to reach its peak. Buyers continue to capitalize on price retracements, aiming for higher levels. The next key target is the $3,000 price zone, which could serve as a psychological resistance level, possibly triggering a significant pullback in the coming days or weeks.
The Elliott Wave structure on the daily chart indicates that the supercycle wave (II) concluded in December 2015, leading to the beginning of wave (III). Within this wave, wave ((5)) of I of (III) started in September 2022, signaling that wave I of (III) remains incomplete. This suggests further upside potential for gold. On a lower degree, the price is yet to finalize wave (3) of ((5)), and as per Elliott Wave theory, wave (3) is expected to push gold prices above the $3,000 mark.
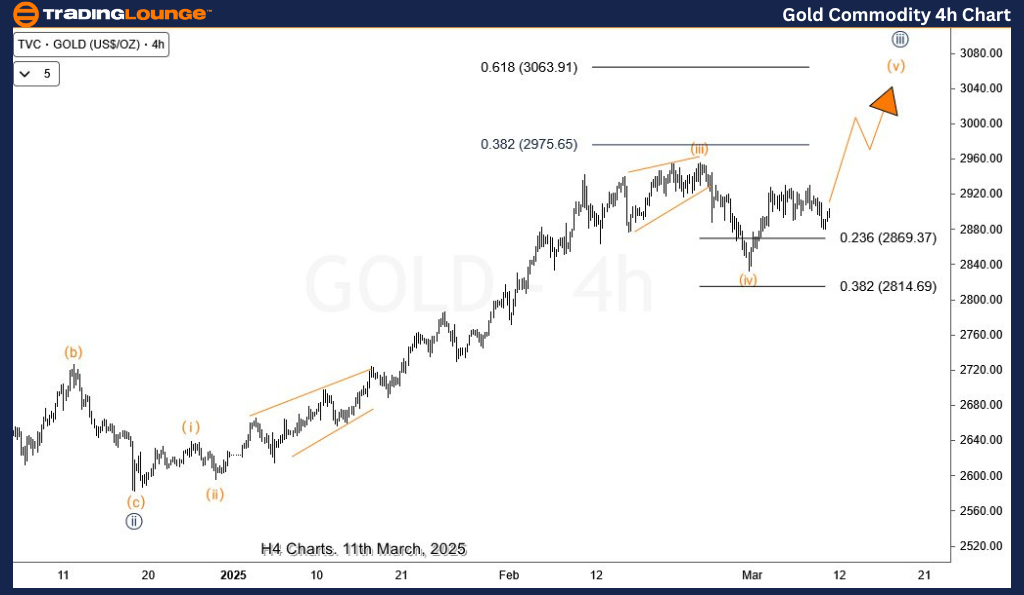
Gold H4 Chart Analysis
On the 4-hour (H4) chart, the price is currently in wave (v) of (iii) of 5 of (3) from the late February low. Alternatively, the present recovery might represent wave ((v)) of 5 of (3), reinforcing the short-term bullish outlook toward $3,000 or slightly below it.
The next anticipated pullback is likely to be wave ((iv)) of 5 of (3) or (4). Regardless of its structure, this retracement could provide fresh buying opportunities for traders looking to capitalize on gold’s bullish trend.
Technical Analyst: Sanmi Adeagbo
Source: Visit Tradinglounge.com and learn from the Experts Join TradingLounge Here
See Previous: Copper Elliott Wave Technical Analysis
VALUE Offer - Buy 1 Month & Get 3 Months!Click here
Access 7 Analysts Over 200 Markets Covered. Chat Room With Support