Welcome to Our Latest Elliott Wave Analysis for Costco Wholesale Corp. (COST)
This comprehensive Elliott Wave analysis delves into Costco Wholesale Corp.'s (COST) price movements, utilizing Elliott Wave Theory to help traders spot potential opportunities based on current trends and market structures. We will examine insights from both the daily and 4-hour charts to provide a thorough perspective on COST's market behavior.
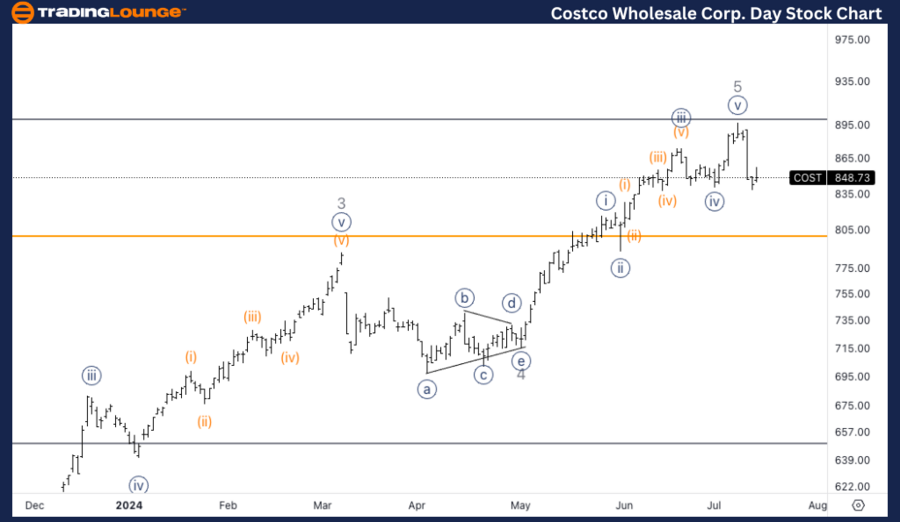
Costco Wholesale Corp. (COST) Elliott Wave Analysis - Daily Chart
COST Daily Chart Technical Analysis
COST Elliott wave Technical Analysis
FUNCTION: Counter Trend
MODE: Corrective
STRUCTURE: ZigZag
POSITION: Wave A
DIRECTION: Downside in wave A
DETAILS: The upside move seems to have completed, indicating a possible correction at the top of wave (5) or wave 1 of (5).
The daily chart suggests that the upward movement has finished, and we are now expecting a correction. This correction might mark the completion of a top in wave (5) or wave 1 of (5). Traders should be ready for ongoing downside pressure as wave A progresses.

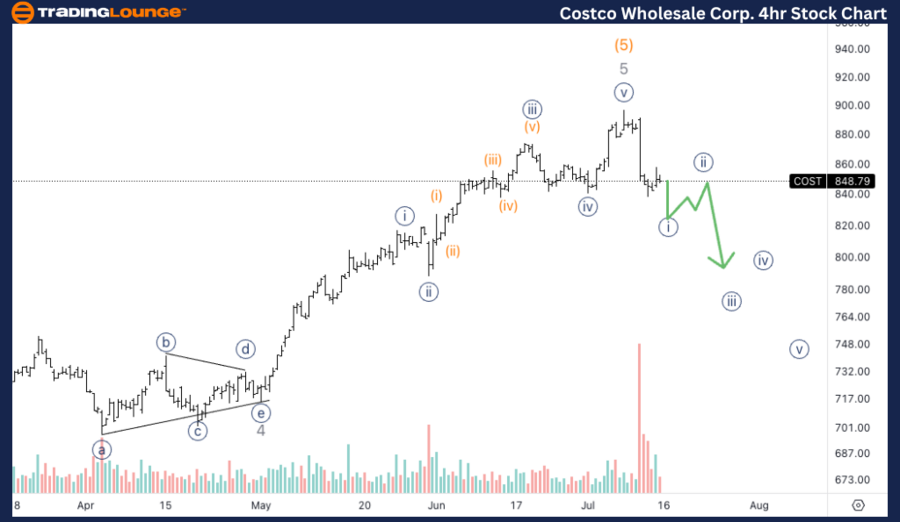
Costco Wholesale Corp. (COST) Elliott Wave Analysis - 4-Hour Chart
COST 4-Hour Chart Technical Analysis
COST Stock Technical Analysis
FUNCTION: Counter Trend
MODE: Corrective
STRUCTURE: ZigZag
POSITION: Wave {i}
DIRECTION: Bottom in wave {i}
DETAILS: Anticipating a bottom in wave {i} before a pullback, followed by at least one more leg down, potentially wave {iii} or a form of wave C.
The 4-hour chart indicates we are looking for a bottom in wave {i}, followed by a pullback. After this pullback, we expect at least one more leg down, which could be wave {iii} or some type of wave C.
Technical Analyst: Alessio Barretta
Source: visit Tradinglounge.com and learn From the Experts Join TradingLounge Here
See Previous: NVIDIA Corp. (NVDA) Ellott Wave Technical Analysis
Special Trial Offer - 0.76 Cents a Day for 3 Months! Click here
Access 7 Analysts Over 170 Markets Covered. Chat Room With Support
