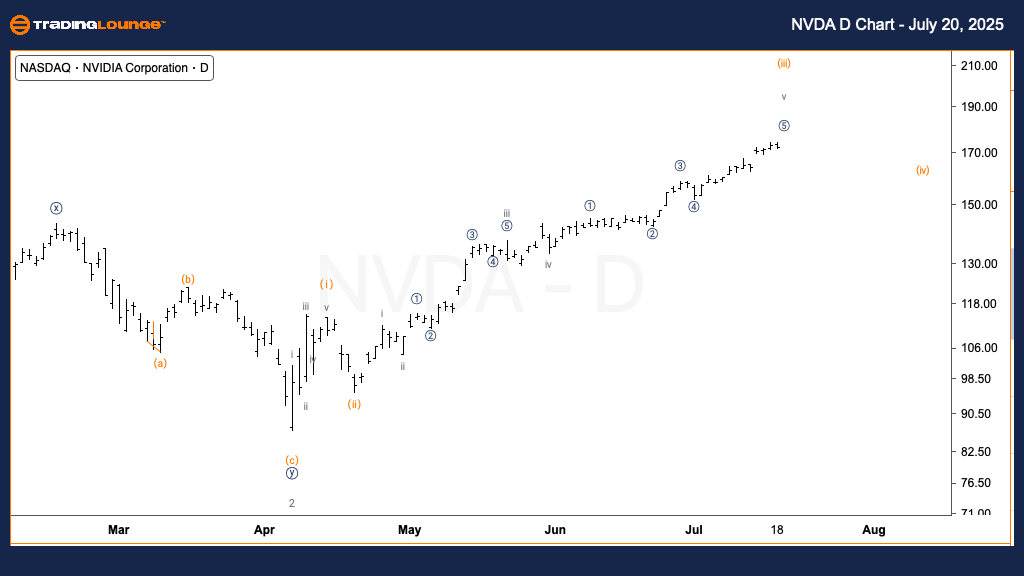
NVDA Elliott Wave Analysis – Trading Lounge Daily Chart
NVIDIA Corp. (NVDA) US Stock Daily Chart Analysis
NVDA Elliott Wave Technical Analysis – Daily View
FUNCTION: Trend
MODE: Impulsive
STRUCTURE: Motive
POSITION: Wave (iii)
DIRECTION: Upside in Wave (iii)
DETAILS: The latest Elliott Wave count for NVIDIA Corp. (NVDA) signals that the stock is advancing in wave (iii) of a broader impulsive pattern. NVDA price action is currently positioned in the higher band of MinorGroup2, hovering near the $180 mark. Technical projections indicate potential upside movement toward TradingLevel2 at $200 before wave (iii) concludes. Investors and traders should monitor for reversal signals as the current upward trend matures.
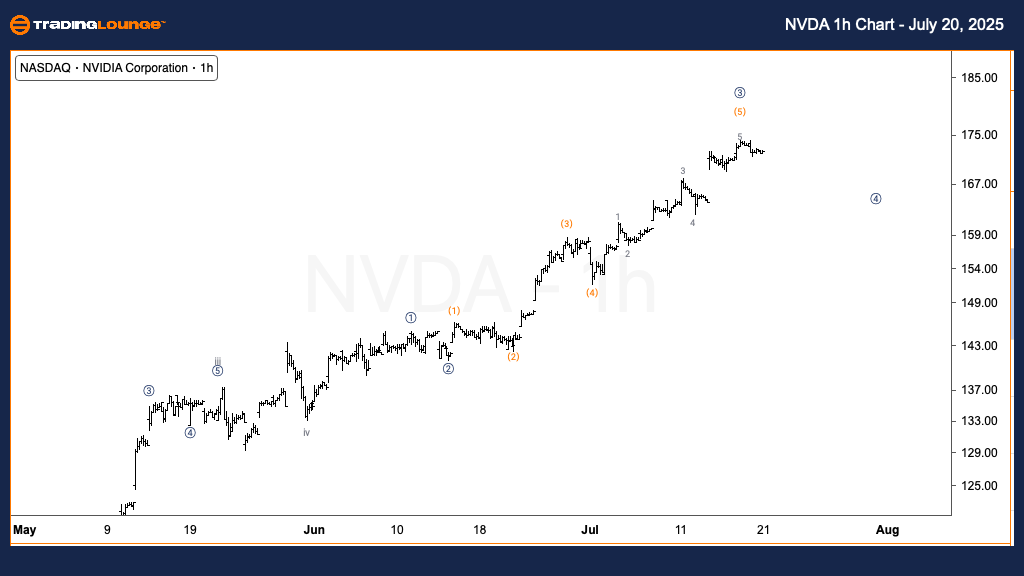
NVDA Elliott Wave Analysis – Trading Lounge 1-Hour Chart
NVIDIA Corp. (NVDA) – 1H Chart Analysis
NVDA Elliott Wave Technical Analysis – Intraday View
FUNCTION: Trend
MODE: Impulsive
STRUCTURE: Motive
POSITION: Micro Wave 3
DIRECTION: Nearing Top in Micro Wave 3
DETAILS: On the 1-hour chart, NVDA is actively progressing through micro wave 3, which is approaching its potential peak. The wave structure suggests that subminuette wave iv has finalized, setting the stage for a minor corrective pullback within micro wave 4. A subsequent upward leg in micro wave 5 is anticipated, likely marking the end of the larger wave (iii). Traders should look for brief consolidation periods followed by renewed bullish momentum, especially as the price approaches key resistance near the $200 level.
Key Takeaways for NVDA Traders and Investors:
- Wave (iii) in daily analysis points to a strong upside with room to reach $200.
- Micro wave 3 on the 1H chart shows potential nearing completion with final wave 5 move ahead.
- Technical zones at $180 and $200 are crucial for monitoring price action.
- Elliott Wave Theory offers a structured outlook for short-term and medium-term NVDA strategies.
This multi-timeframe analysis of NVIDIA Corp. (NVDA) using Elliott Wave Theory provides a detailed perspective for both swing traders and intraday analysts, enhancing technical decision-making at crucial market levels.
Technical Analyst: Alessio Barretta
Source: Visit Tradinglounge.com and learn from the Experts. Join TradingLounge Here
See Previous: Spotify (SPOT) Elliott Wave Technical Analysis
VALUE Offer - $1 for 2 Weeks then $29 a month!Click here
Access 7 Analysts Over 200 Markets Covered. Chat Room With Support