Gold (XAUUSD) Commodity Elliott Wave Analysis

Gold recently experienced a pullback after hitting a fresh all-time high in August 2024. While this decline might seem concerning, it could be a temporary correction before buyers return, potentially pushing prices to new peaks. However, technical indicators suggest the possibility of a larger retracement ahead.

Gold Elliott Wave Technical Analysis

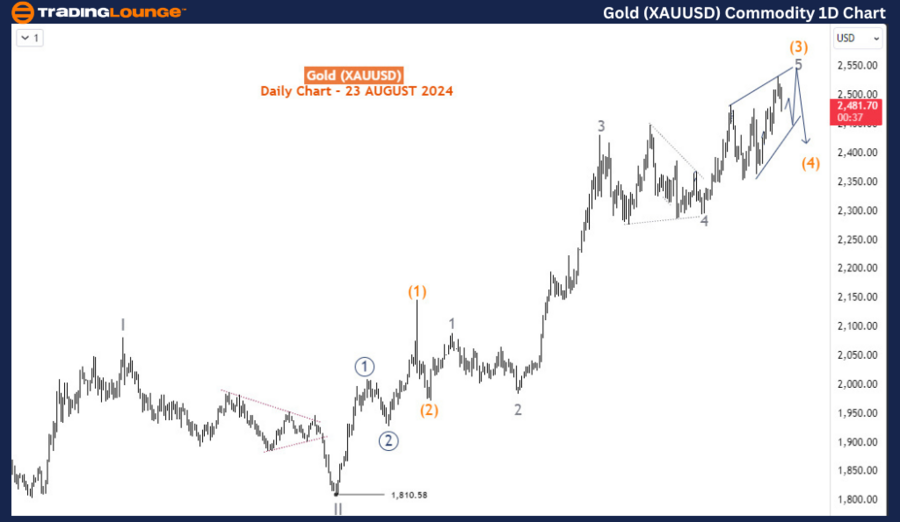
Gold (XAUUSD) Daily Chart Analysis

From a long-term perspective, Gold completed its supercycle wave (IV) within the ongoing bullish trend that began in December 2015. This completion paved the way for the initiation of a new impulse wave (V). Within this impulse, the primary degree waves I and II were completed in May and October 2023, respectively. Currently, Gold is advancing within the intermediate degree wave (3) of the primary degree wave 3 (circled) of cycle degree wave III, as depicted on the daily chart.

The price action suggests that wave (3) is approaching completion with a diagonal wave 5 structure, indicating that a corrective wave (4) could soon follow. Despite this potential pullback, the broader trend remains bullish, and further upward movement is expected after the correction completes. The end of wave (3) would likely lead to a consolidation phase before the market resumes its upward trajectory in wave (5).

Gold-XAUUSD-Commodit...


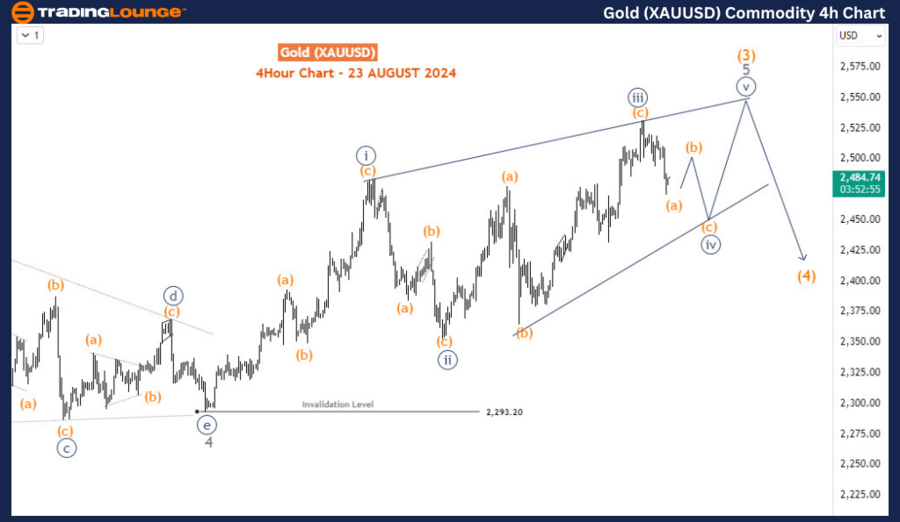
Gold (XAUUSD) 4-Hour Chart Analysis

The H4 chart provides more detailed insight into the short-term structure. It shows the development of a diagonal for wave 5, emerging after a breakout from the wave 4 triangle range in June 2024 at the 2293 level. The initial rally pushed Gold above this resistance, confirming the start of wave 5. The internal structure of wave 5 indicates that waves i-iii (circled) have been completed, while the ongoing dip represents the formation of wave iv (circled).

One final push higher is anticipated in wave v (circled), which could propel Gold above the psychological level of 2500 and closer to 2550. This zone may serve as a potential exit point for buyers, marking the end of wave (3). If this scenario materializes, a larger pullback could occur as part of wave (4) before the next bullish phase begins.

Technical Analyst: Sanmi Adeagbo

Source: visit Tradinglounge.com and learn From the Experts Join TradingLounge Here 

See Previous: Crude Oil Elliott Wave Technical Analysis

Special Trial Offer - 0.76 Cents a Day for 3 Months! Click here

Access 7 Analysts Over 200 Markets Covered. Chat Room With Support

Gold-XAUUSD-Commodit...


Conclusion

Overall, while the long-term outlook for Gold remains positive, traders should brace for short-term volatility and a possible corrective dip before the market resumes its upward trend.

Related

New Zealand Dollar/U.S.Dollar(NZDUSD) Forex Elliott Wave Technical Analysis: In-Depth Overview for Traders

New Zealand Dollar/U.S.Dollar(NZDUSD) Forex Elliott Wave Technical Analysis: In-Depth Overview for Traders

Elliott Wave analysis of the NZDUSD currency pair, covering day and 4-hour charts highlights key tre...

Read More >
British Pound/Japanese Yen(GBPJPY) Elliottwave Technical analysis - A Comprehensive Overview for Day and 4-Hour Charts

British Pound/Japanese Yen(GBPJPY) Elliottwave Technical analysis - A Comprehensive Overview for Day and 4-Hour Charts

This comprehensive guide offers an in-depth Elliott Wave analysis of the GBPJPY currency pair, provi...

Read More >
TXN Elliott Wave Technical Analysis: Understanding Texas Instruments Inc. Stock Trends and Chart Analysis

TXN Elliott Wave Technical Analysis: Understanding Texas Instruments Inc. Stock Trends and Chart Analysis

Dive into comprehensive TXN Elliott Wave analysis to uncover trends, forecasts, and trading strategi...

Read More >
Unlocking ASX Trading Success: SCENTRE GROUP (SCG) Stock Analysis & Elliott Wave Technical Forecast

Unlocking ASX Trading Success: SCENTRE GROUP (SCG) Stock Analysis & Elliott Wave Technical Forecast

Get comprehensive insights into SCENTRE GROUP (SCG) stock on the ASX with our Elliott Wave analysis....

Read More >
Discover the latest VanEck Semiconductor ETF (SMH) Stocks Elliott Wave Technical Analysis

Discover the latest VanEck Semiconductor ETF (SMH) Stocks Elliott Wave Technical Analysis

Discover the latest Elliott Wave analysis of the VanEck Semiconductor ETF (SMH) as of May 2024. This...

Read More >
Explore Effective Trading Strategies for Polkadot Crypto Price: DOTUSD Elliott Wave Technical Analysis

Explore Effective Trading Strategies for Polkadot Crypto Price: DOTUSD Elliott Wave Technical Analysis

In this article, we provide an in-depth Elliott Wave analysis of Polkadot (DOTUSD), focusing on the ...

Read More >

Buy 1 Month

Get 3 Months!

Special Offer:

Trade Recommendations

Unleash the power of deversified trading with our comprehensive portfolio, covering:

  • Stock Trades
  • Crypto Trades
  • Forex Trades
  • Commodity Trades
Elliott Wave Analysis

Gain a competive edge with expert insights in to:

  • Global Indices
  • US Stocks & ASX Stocks
  • Forex & Crypto
  • Commodities
Top-Notch Trading Tools

Equip yourself with the tools of success:

  • Social Chat
  • Elliott Wave Algorithm
  • Screener
  • TradingLevels
  • Trading Game
7 Elliott Wave Analysts

Stay ahead of the market with daily charts and insightful videos
-Your secret to strategic trading!

JOIN HERE


Welcome to TradingLounge (ASIC A.R.No. 321187), specialists in trades, trading education and technical analysis, covering stocks, indices, commodities, forex and cryptocurrencies.

When you join TradingLounge you have access to everything we offer, including trade tools, educational content and a social platform to chat with like-minded investors.

Read more

@Copyright 2024 by tradinglounge.com

Contact Us

Australian no: 02 4787 6020

International no: +61 (2) 47876020

Pay with:

Find us on