13Mar

Copper Elliott Wave Technical Analysis: Market Analysis through Elliott Wave Perspective

Copper Market Analysis - Elliott Wave Perspective

Copper, a highly traded commodity, is currently demonstrating intriguing patterns within a pivotal resistance zone, indicating potential market dynamics. An ending diagonal pattern formation implies a culmination of bullish momentum within this zone, potentially signalling an impending pullback followed by a resumption of the upward trend.

Copper Elliott Wave Technical Analysis

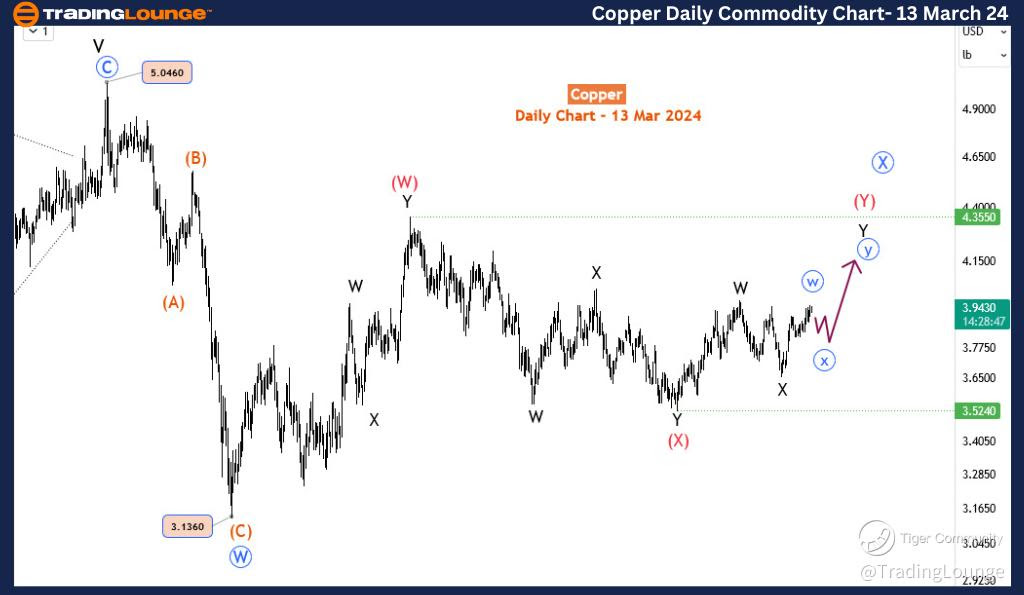
Copper Day Chart Analysis

Exploring the broader framework on the daily timeframe, the trajectory of Copper's price reveals a complex corrective structure termed a double zigzag correction. This corrective phase initiated from 3.136 in July 2022 and has since evolved through two distinct legs: wave (W) concluding at 4.355 in January 2023, followed by wave (X) reaching its terminus at 3.524 in October 2023. The current focus is on wave (Y), which is unfolding into another double zigzag pattern. Forecasts indicate potential extensions towards levels approximately at 4.45 and 4.90. It's noteworthy that both waves W and X of Y have completed, with wave Y displaying indications of sustained upward momentum.

Copper-daily-commodi...


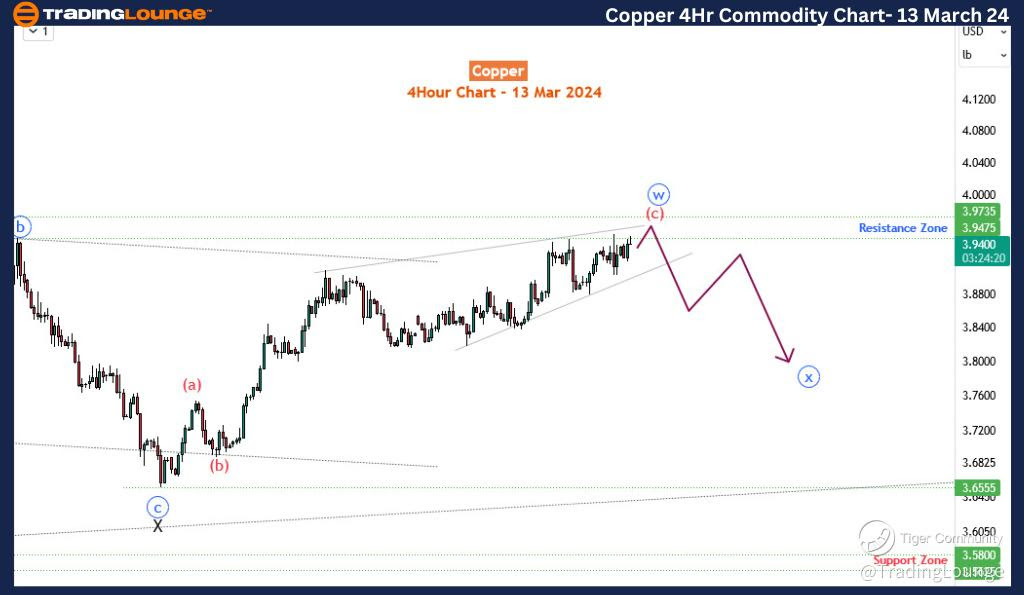
Copper Elliott Wave Analysis Trading Lounge 4 Hour Chart, 12 March 24  

Copper 4-hour Chart Analysis

Zooming in on the H4 timeframe provides deeper insights into the sub-waves of wave Y. Originating from 3.655, wave Y is presently unfolding as a zigzag pattern, with specific emphasis on wave (c). This sub-wave of blue wave Y is constructing an ending diagonal pattern within the previously mentioned resistance zone, suggesting a possible exhaustion of buying pressure. The anticipation of blue wave x arises if Copper remains below the resistance zone of 3.9475-3.9735, potentially leading to a temporary retracement. After wave x, expectations lean towards wave y of Y recommencing the bullish trajectory, targeting around 4.45.

To summarize, Copper's price action hints at a complex corrective phase within a significant resistance area, likely paving the way for a brief pullback before a continuation of the overarching bullish trend. A comprehensive understanding of these patterns across various timeframes furnishes valuable insights for traders navigating the ever-evolving commodity markets.

Technical Analyst: Sanmi Adeagbo

Source: visit Tradinglounge.com and learn From the Experts Join TradingLounge Here 

See Previous: Cocoa 

TradingLounge Once Off SPECIAL DEAL: Here > 1 month Get 3 months.   

Copper-4Hr-commodity...

Related

NIFTY 50 Elliott Wave Technical Forecast: Stock Market Trends, Support & Resistance, Price Predictions, and Trading Signals

NIFTY 50 Elliott Wave Technical Forecast: Stock Market Trends, Support & Resistance, Price Predictions, and Trading Signals

NIFTY 50 Elliott Wave analysis, detailing key support and resistance levels, trend forecasts, and pr...

Read More >
KOSPI Composite Elliott Wave Analysis: Market Forecast, Key Support at 2,438.17, Trading Strategy & Price Prediction

KOSPI Composite Elliott Wave Analysis: Market Forecast, Key Support at 2,438.17, Trading Strategy & Price Prediction

The KOSPI Composite Elliott Wave Analysis indicates a bullish trend, with the market currently in Or...

Read More >
Commodity Market Insights: Crypto Trends, Forex Movements, and Metals Analysis for Strategic Trading

Commodity Market Insights: Crypto Trends, Forex Movements, and Metals Analysis for Strategic Trading

Summary: Bitcoin, DOT, and XRP show upward trends in the crypto market, prompting consideration of l...

Read More >
Comprehensive ASX Trading Guide: Woodside Energy Group (WDS) Stock Analysis and Elliott Wave Forecast

Comprehensive ASX Trading Guide: Woodside Energy Group (WDS) Stock Analysis and Elliott Wave Forecast

This analysis provides a comprehensive Elliott Wave outlook for ASX: Woodside Energy Group (WDS). Ga...

Read More >
British Pound/ Australian Dollar (GBPAUD) Forex Elliott Wave Technical Analysis: It covers both daily and 4-hour chart forecasts

British Pound/ Australian Dollar (GBPAUD) Forex Elliott Wave Technical Analysis: It covers both daily and 4-hour chart forecasts

This article provides a comprehensive Elliott Wave analysis of the GBPAUD currency pair. It covers b...

Read More >
Watch CAT Stock Progresses through its Current Market Structure Using Caterpillar Inc. (CAT) Elliott Wave Technical Analysis

Watch CAT Stock Progresses through its Current Market Structure Using Caterpillar Inc. (CAT) Elliott Wave Technical Analysis

This article provides a comprehensive Elliott Wave analysis of Caterpillar Inc. (CAT), examining bot...

Read More >

Buy 1 Month

Get 3 Months!

Special Offer:

Trade Recommendations

Unleash the power of deversified trading with our comprehensive portfolio, covering:

  • Stock Trades
  • Crypto Trades
  • Forex Trades
  • Commodity Trades
Elliott Wave Analysis

Gain a competive edge with expert insights in to:

  • Global Indices
  • US Stocks & ASX Stocks
  • Forex & Crypto
  • Commodities
Top-Notch Trading Tools

Equip yourself with the tools of success:

  • Social Chat
  • Elliott Wave Algorithm
  • Screener
  • TradingLevels
  • Trading Game
7 Elliott Wave Analysts

Stay ahead of the market with daily charts and insightful videos
-Your secret to strategic trading!

JOIN HERE


Welcome to TradingLounge (ASIC A.R.No. 321187), specialists in trades, trading education and technical analysis, covering stocks, indices, commodities, forex and cryptocurrencies.

When you join TradingLounge you have access to everything we offer, including trade tools, educational content and a social platform to chat with like-minded investors.

Read more

@Copyright 2024 by tradinglounge.com

Contact Us

Australian no: 02 4787 6020

International no: +61 (2) 47876020

Pay with:

Find us on