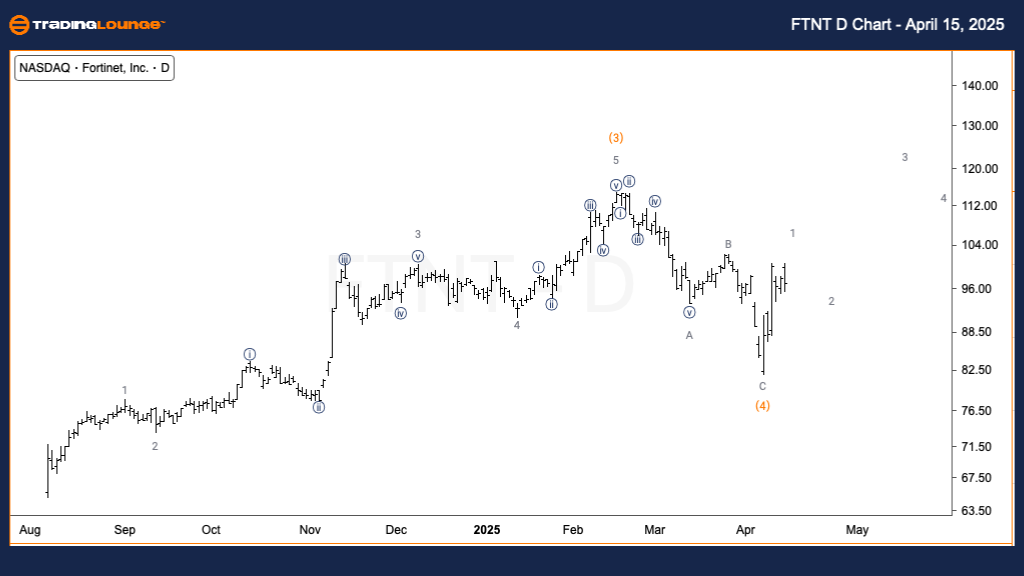
FTNT Elliott Wave Analysis - TradingLounge Daily Chart
Fortinet Inc. (FTNT) Daily Chart Analysis
Fortinet Inc. (FTNT) Elliott Wave Technical Analysis
Mode: Impulsive
Structure: Motive
Position: Wave 1 of (5)
Direction: Short-term top forming in wave 1
Details: Fortinet Inc. ($FTNT) is advancing in an impulsive Elliott Wave sequence, with Minor wave 1 nearing completion after a well-defined three-wave correction in Intermediate wave (4). Traders should anticipate a corrective wave 2 pullback before the uptrend resumes into wave (5), offering potential long setups in line with bullish momentum.
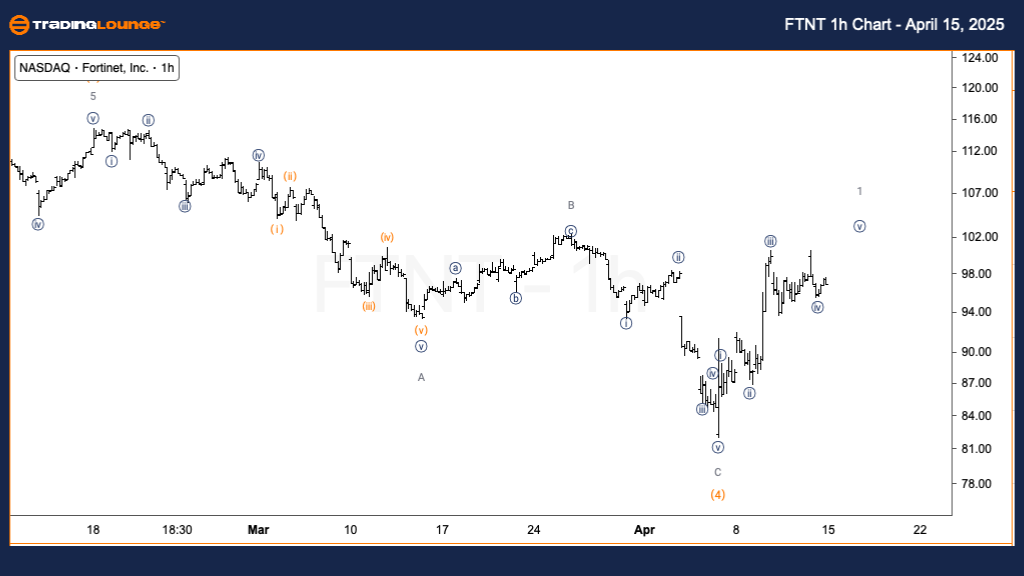
FTNT Elliott Wave Analysis - TradingLounge 1H Chart
Fortinet Inc. (FTNT) 1H Chart Analysis
Mode: Impulsive
Structure: Motive
Position: Wave {v} of 1
Direction: Upside expected into wave {v}
Details: On the 1-hour chart, Fortinet ($FTNT) is consolidating within Minute wave {iv}, preparing for a push higher into wave {v}. Maintaining price action above key support at TradingLevel1 ($100) is essential for confirming the next bullish leg.
Technical Analyst: Alessio Barretta
Source: Visit Tradinglounge.com and learn from the Experts. Join TradingLounge Here
Previous:Walmart Inc. (WMT) Elliott Wave Technical Analysis
VALUE Offer - Buy 1 Month & Get 3 Months!Click here
Access 7 Analysts Over 200 Markets Covered. Chat Room With Support