Welcome to the latest Elliott Wave Analysis for AAVE/ U.S. dollar (AAVEUSD) on the TradingLounge Daily Chart and 4Hr Chart, dated February 14, 2024. In this comprehensive report, we'll delve into the technical intricacies of AAVEUSD, applying Elliott Wave Theory to guide traders through potential market movements. Join us as we explore the counter-trend dynamics, corrective patterns, and strategic insights for informed decision-making.
TradingLounge Daily Chart - AAVE/ U.S. dollar(AAVEUSD):
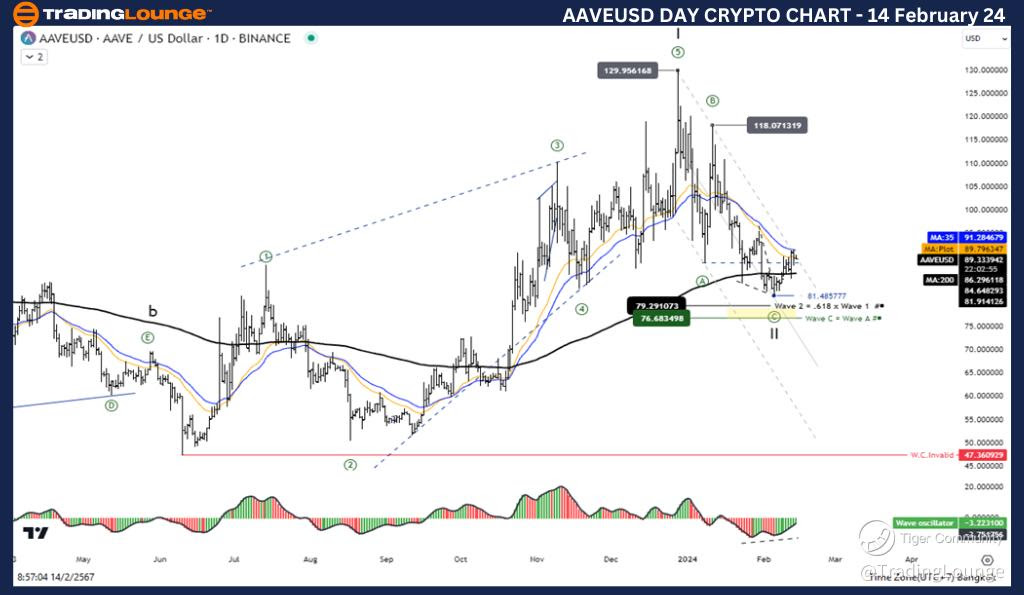
AAVEUSD Elliott Wave Technical Analysis
Function: Counter Trend
Mode: Corrective
Structure: Zigzag
Position: Wave ((C))
Direction Next higher Degrees: Wave II of Impulse
Wave Cancel invalid Level: 47.34
Detailed Analysis: Our analysis indicates that AAVEUSD is currently in a corrective phase marked by a zigzag pattern, specifically in Wave ((C)). As of the latest data, Wave II of the larger Impulse is in progress. It is crucial to note that the invalidation level for this wave is set at 47.34.
The recent correction in Wave II appears to have been completed near the 81.485 level. Anticipating a bullish resurgence, we are inclined to believe that a five-wave increase is imminent, supporting the idea of an upward price trajectory.
Trading Strategy: Considering the completion of Wave II correction at the 81.485 level, our outlook for AAVEUSD is optimistic. We foresee a bullish trend shortly, characterized by a five-wave increase. This projection serves as the foundation for our trading strategy, highlighting potential opportunities for traders to capitalize on the anticipated upward movement.
AAVE/ U.S. dollar(AAVEUSD) – Technical Indicators:
In addition to the AAVEUSD analysis, let's briefly examine the AAVE/ U.S. dollar(AAVEUSD) based on technical indicators. The price of AAVEUSD is currently positioned above the MA200, signaling an uptrend. Furthermore, Wave Oscillators suggest a bullish momentum, reinforcing the positive outlook for this cryptocurrency pair.
TradingLounge Analyst: Kittiampon Somboonsod, CEWA
TradingLounge 4Hr Chart - AAVE/ U.S. dollar(AAVEUSD):
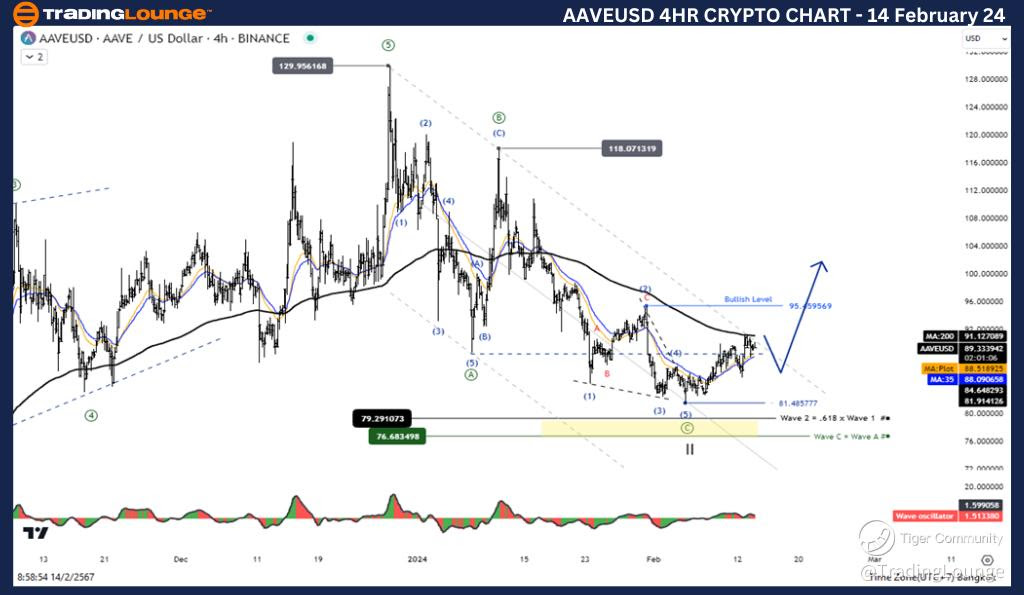
Elliott Wave Technical Analysis:
Function: Counter Trend
Mode: Corrective
Structure: Zigzag
Position: Wave ((C))
Direction Next higher Degrees: Wave II of Impulse
Wave Cancel invalid Level: 47.34
Detailed Analysis: Reiterating our analysis on the 4Hr Chart, AAVEUSD continues to exhibit counter-trend characteristics, showcasing a corrective zigzag pattern in Wave ((C)). As mentioned earlier, the ongoing correction in Wave II is expected to conclude soon, paving the way for a five-wave increase.
Trading Strategy: Aligned with the Daily Chart analysis, the 4Hr Chart reinforces our belief that the Wave II correction is likely over, marked at the 81.485 level. Anticipating a bullish phase, characterized by a five-wave increase, traders can consider this information in their decision-making processes.
AAVE/ U.S. dollar(AAVEUSD) – Technical Indicators: Mirroring the Daily Chart, the 4Hr Chart analysis for AAVEUSD reveals consistent bullish signals. With the price comfortably above the MA200 and Wave Oscillators indicating bullish momentum, traders can find confidence in the positive trajectory of AAVEUSD.
TradingLounge Analyst: Kittiampon Somboonsod, CEWA
Source: visit Tradinglounge.com and learn From the Experts Join TradingLounge Here
See Previous: Binance Coin (BNBUSD)
Conclusion: In conclusion, the Elliott Wave Analysis for AAVE/ U.S. dollar (AAVEUSD) on both the TradingLounge Daily and 4Hr Charts suggests a favorable outlook. With Wave II correction likely completed, traders are encouraged to consider potential opportunities in the anticipated five-wave increase. Additionally, the positive technical indicators for the AAVE/ U.S. dollar (AAVEUSD) add further credence to the overall bullish sentiment in the cryptocurrency market. Stay tuned for real-time updates as market dynamics evolve. Happy trading!