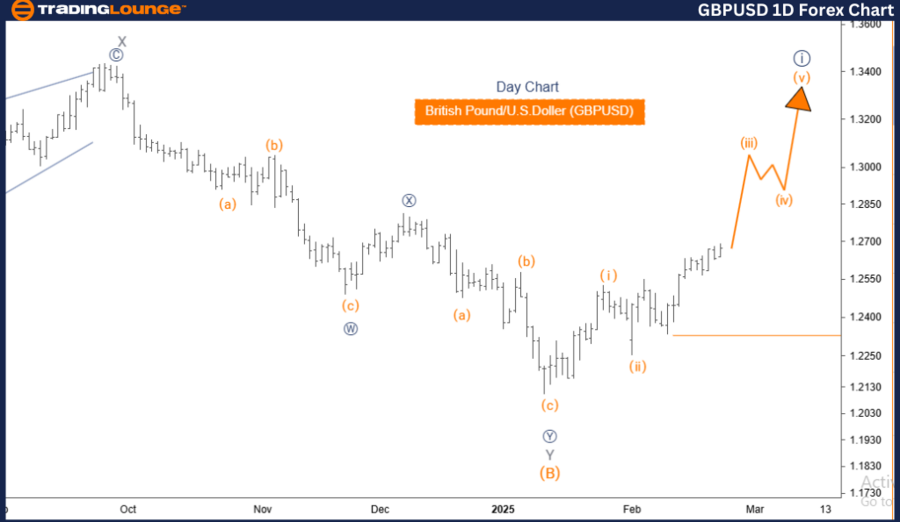
GBPUSD Elliott Wave Analysis – Trading Lounge Day Chart
British Pound/ U.S. Dollar (GBPUSD) Day Chart Analysis
GBPUSD Elliott Wave Technical Analysis
- Function: Bullish Trend
- Mode: Impulsive
- Structure: Orange Wave 3
- Position: Navy Blue Wave 1
- Next Lower Degree Movement: Orange Wave 2
- Wave Cancellation Invalid Level: 1.23270
GBPUSD Forex Pair Analysis Details
The GBPUSD Elliott Wave Analysis for the daily chart highlights a strong bullish trend, with the market currently in an impulsive mode. The prevailing wave structure is Orange Wave 3, which is a component of the larger Navy Blue Wave 1, signifying an ongoing upward movement.
Following the completion of Orange Wave 3, the market is anticipated to shift into Orange Wave 2, indicating a potential corrective phase before resuming its upward momentum.
Currently, the market is progressing through Orange Wave 3, which is expected to exhibit strong bullish momentum, characteristic of impulsive wave patterns. Traders should closely monitor Orange Wave 3, as its conclusion could trigger Orange Wave 2, leading to possible pullbacks or consolidation before the next bullish leg.
A key support level to watch is 1.23270. If the price declines below this level, the current wave structure will be invalidated, necessitating a reassessment of the Elliott Wave count. This level acts as a crucial support threshold, and any breach could indicate a trend shift or an adjustment in the wave structure.
Summary
GBPUSD remains in a bullish trend, with Orange Wave 3 currently unfolding after the completion of Orange Wave 2.
The next expected movement is Orange Wave 2, which may bring a corrective phase before the trend resumes.
Key Level to Monitor: 1.23270, serving as a significant validation point for the wave count and maintaining the overall bullish outlook.
Understanding Elliott Wave structures helps traders anticipate potential market movements and optimize trading strategies accordingly.
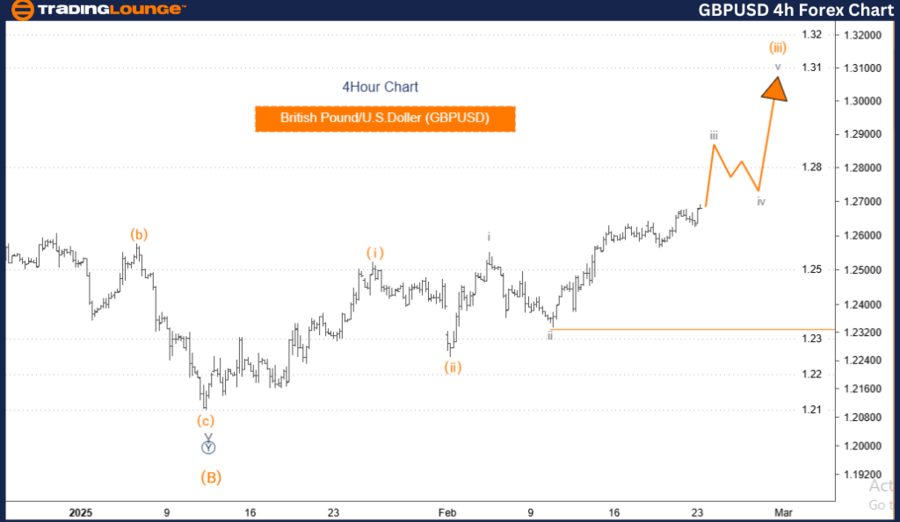
British Pound/ U.S. Dollar (GBPUSD) 4-Hour Chart
GBPUSD Elliott Wave Technical Analysis
- Function: Bullish Trend
- Mode: Impulsive
- Structure: Gray Wave 3
- Position: Orange Wave 3
- Next Lower Degree Movement: Gray Wave 4
- Wave Cancellation Invalid Level: 1.23270
British Pound/ U.S. Dollar Currency Pair Analysis Details
The GBPUSD Elliott Wave Analysis for the 4-hour chart confirms a strong bullish trend, with the market currently in an impulsive wave phase. The current wave structure is Gray Wave 3, which forms part of the larger Orange Wave 3, indicating strong upward momentum.
Upon completion of Gray Wave 3, the market is expected to transition into Gray Wave 4, introducing a potential corrective movement before continuing higher.
Currently, the market is in Gray Wave 3, which is expected to sustain strong bullish momentum consistent with an impulsive wave. Traders should closely track Gray Wave 3, as its completion could signal the emergence of Gray Wave 4, which may lead to short-term pullbacks or consolidation before the trend resumes.
A critical support level is 1.23270. If the price falls below this mark, it would invalidate the current wave count, requiring a reevaluation of the market structure. This level is a key reference point, and any breach could suggest a potential trend shift or wave count adjustment.
Summary
- GBPUSD remains in a bullish trend, with Gray Wave 3 actively forming after Gray Wave 2's completion.
- The next expected movement is Gray Wave 4, which may introduce a corrective phase before the bullish trend resumes.
- Key Level to Monitor: 1.23270, acting as a pivotal validation level for the wave count and overall bullish market outlook.
- Elliott Wave analysis is crucial for forecasting market trends, allowing traders to adjust their strategies effectively.
Technical Analyst: Malik Awais
Source: visit Tradinglounge.com and learn From the Experts Join TradingLounge Here
Previous: USDCHF Elliott Wave Technical Analysis
VALUE Offer - Buy 1 Month & Get 3 Months!Click here
Access 7 Analysts Over 200 Markets Covered. Chat Room With Support