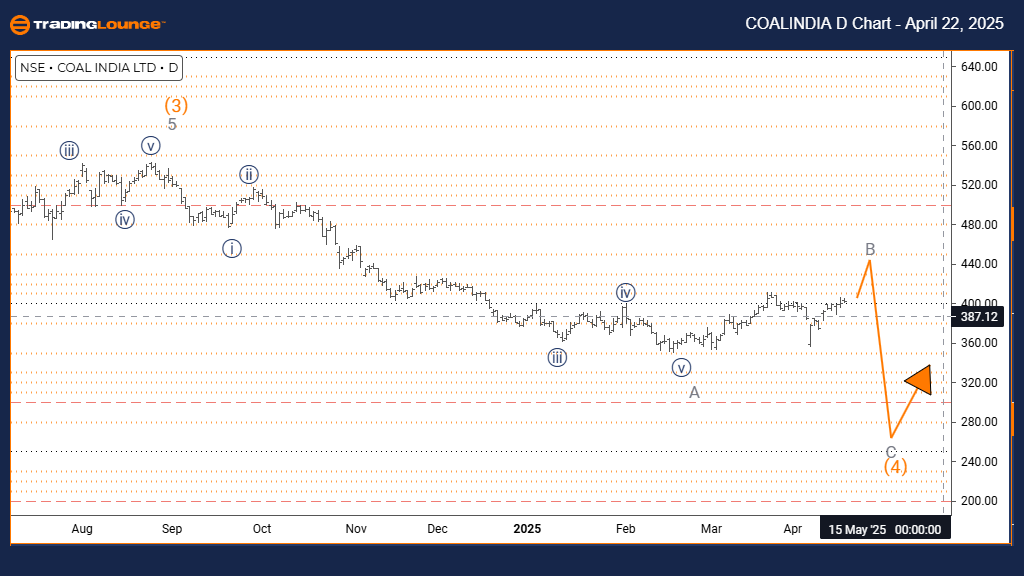
COAL INDIA Elliott Wave Analysis – Trading Lounge Day Chart
COAL INDIA Elliott Wave Technical Analysis
Function: Counter Trend
Mode: Corrective
Structure: Gray Wave B
Position: Orange Wave 4
Direction Next Lower Degrees: Gray Wave C
Details: Gray wave A appears completed; gray wave B is now in progress
The COAL INDIA daily Elliott Wave analysis reveals a corrective phase within a counter-trend setup, signaling a temporary pause in the prevailing downtrend. Gray wave A has likely completed, and gray wave B is now forming within the larger orange wave 4 structure, suggesting a short-term retracement before downside continuation.
Gray wave B is unfolding as a corrective wave, typically retracing part of wave A’s decline. This pattern is known for its overlapping structure and weaker momentum, reinforcing that the current price action is not impulsive. As this wave progresses, limited upside potential is expected before the trend resumes lower.
Once gray wave B completes, the formation of gray wave C is anticipated, aligning with the continuation of the primary bearish trend. This upcoming leg is projected to complete the broader correction of orange wave 4. The overall daily chart points to a tactical setup where traders can prepare for the next bearish move.
Traders should closely watch for characteristics of wave B such as reduced momentum and overlapping price structure—common signs of corrective action. Spotting these can aid in recognizing the end of the retracement and preparing for the impulsive gray wave C to follow.
This Elliott Wave corrective setup in COAL INDIA offers potential strategic trade opportunities as the market transitions from gray wave B to C. Tracking price behavior and key technical signals is essential to capture movement in the next wave down.
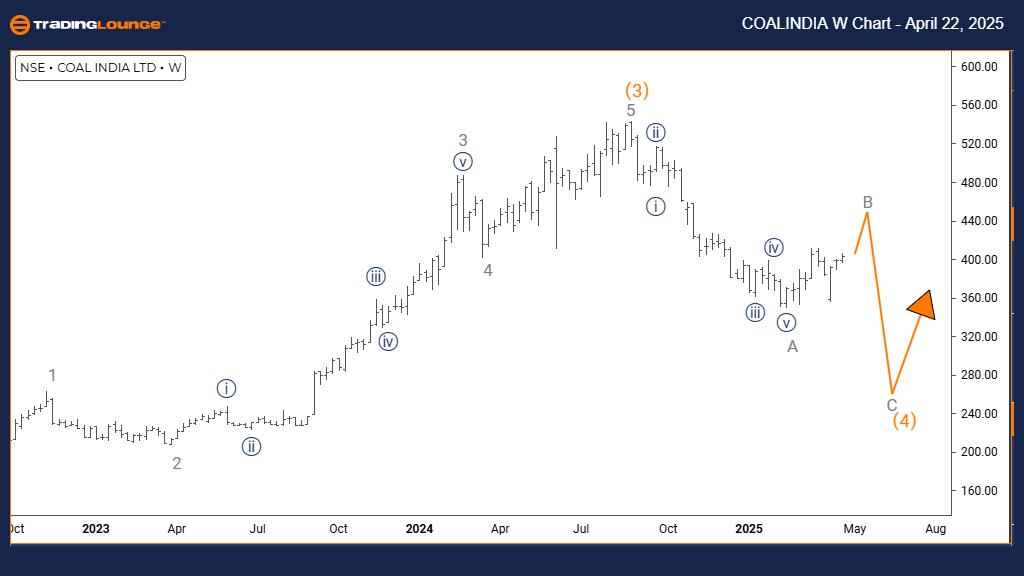
COAL INDIA Elliott Wave Analysis – Trading Lounge Weekly Chart
COAL INDIA Elliott Wave Technical Analysis
Function: Counter Trend
Mode: Corrective
Structure: Gray Wave B
Position: Orange Wave 4
Direction Next Lower Degrees: Gray Wave C
Details: Gray wave A appears completed; wave B is now active
The COAL INDIA weekly Elliott Wave chart highlights a counter-trend correction evolving within a broader bearish structure. Following the conclusion of gray wave A’s decline, gray wave B is now developing, forming part of the larger orange wave 4 retracement. This wave suggests a short-term upside movement before the downtrend likely resumes.
Gray wave B represents a corrective rebound, often retracing 38% to 61% of wave A based on Fibonacci retracement levels. As a corrective wave, it typically features lower momentum and overlapping patterns, which are currently visible on the weekly chart. This indicates a pause in the longer-term bearish trend.
The next projected move is gray wave C, expected to emerge after wave B concludes. This final leg would resume the dominant bearish direction and complete the orange wave 4 correction. Traders should monitor wave B for potential exhaustion signs around key Fibonacci zones, which could indicate a market reversal.
This phase presents a prime setup for bearish positioning aligned with the larger trend. The Elliott Wave structure suggests watching for reversal signals such as bearish candlestick formations and momentum divergences, which often signal the transition into wave C.
The weekly Elliott Wave analysis of COAL INDIA emphasizes the importance of this corrective stage within the broader market trend. Careful observation of wave patterns, key resistance levels, and technical indicators will help identify entry points as the market exits correction and resumes its downward trajectory.
Technical Analyst: Malik Awais
Source: visit Tradinglounge.com and learn From the Experts. Join TradingLounge Here
Previous: AXIS BANK Elliott Wave Technical Analysis
VALUE Offer - Buy 1 Month & Get 3 Months!Click here
Access 7 Analysts Over 200 Markets Covered. Chat Room With Support