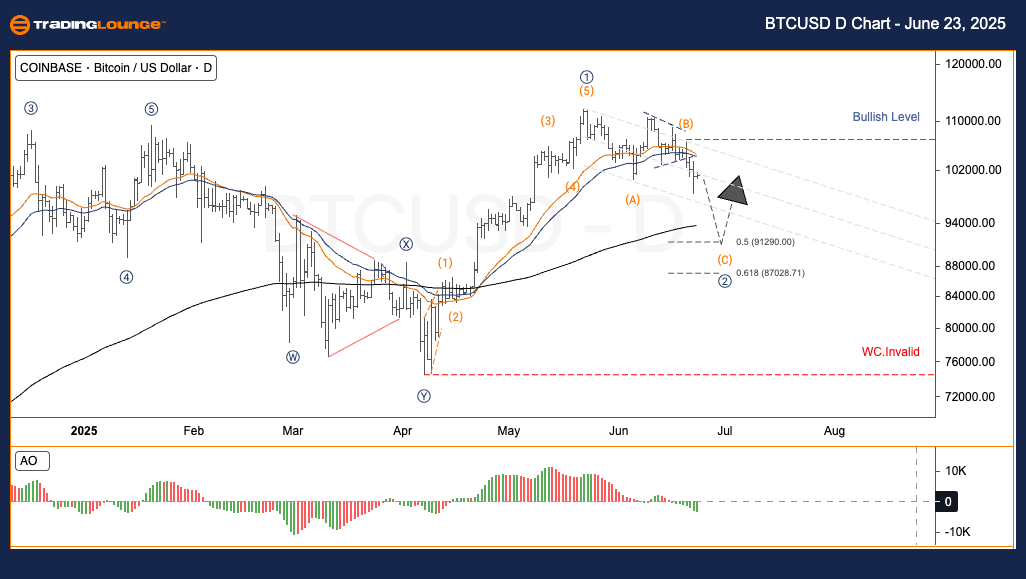
BTCUSD Elliott Wave Analysis – TradingLounge Daily Chart
Bitcoin/ U.S. Dollar (BTCUSD) Daily Chart Analysis
BTCUSD Elliott Wave Technical Analysis
Function: Counter Trend
Mode: Corrective
Structure: Zigzag
Position: Wave C
Direction (Next Higher Degrees): Wave V of Impulse
Invalidation Level:
Bitcoin (BTCUSD) Elliott Wave Forecast & Strategy
Bitcoin recently achieved an all-time high of $120,000. Based on the Elliott Wave pattern, the price action has now transitioned into a Wave 2 corrective phase. This correction is expected to approach the Fibonacci retracement levels of 0.5 to 0.618 before initiating a Wave 3 advance.
Short-Term BTC Trading Strategy (Swing Trade)
- ✅ Closely observe the $91,000 – $87,000 support zone for signs of consolidation or a bullish reversal.
- 🟥 If Bitcoin drops below $87,000 without forming a valid reversal setup, reassess the Elliott Wave count for potential invalidation.
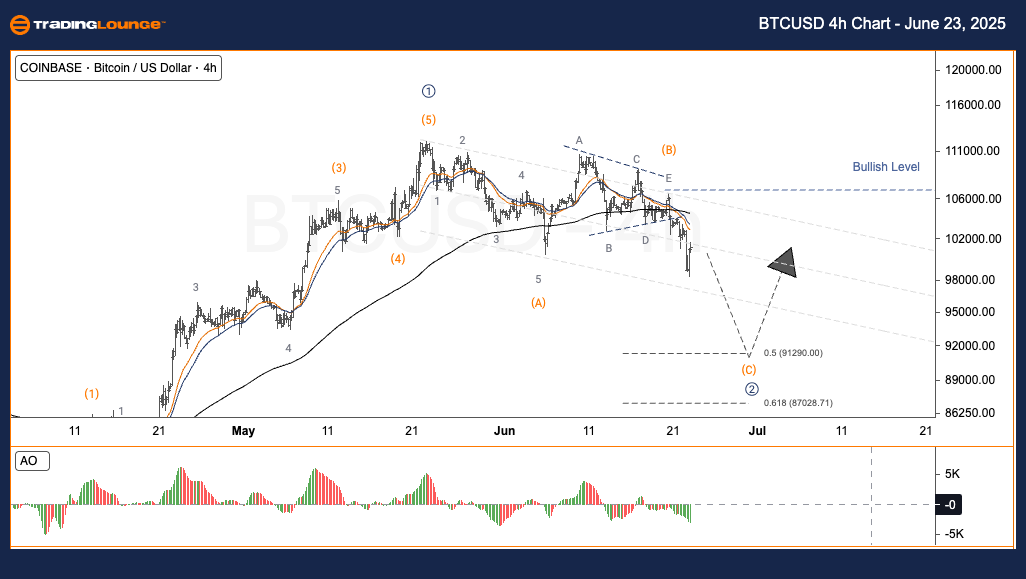
BTCUSD Elliott Wave Analysis – TradingLounge H4 Chart
Bitcoin/ U.S. Dollar (BTCUSD) 4-Hour Chart Analysis
BTCUSD Elliott Wave Technical Analysis
Function: Counter Trend
Mode: Corrective
Structure: Zigzag
Position: Wave C
Direction (Next Higher Degrees): Wave V of Impulse
Invalidation Level:
Bitcoin (BTCUSD) Short-Term Price Outlook
After peaking at $120,000, Bitcoin is undergoing a Wave 2 correction per the Elliott Wave model. Analysts expect the price to retrace toward the 0.5–0.618 Fibonacci support levels before beginning the next bullish Wave 3 phase.
Swing Trading Plan for BTCUSD
- ✅ Focus on the $91,000 – $87,000 region to catch early reversal patterns before entering trades.
- 🟥 A breakdown below $87,000 without reversal signals warrants a revised technical evaluation of the wave pattern.
Technical Analyst: Kittiampon Somboonsod, CEWA
Source: Visit Tradinglounge.com and learn from the Experts. Join TradingLounge Here
Previous: VETUSD Elliott Wave Technical Analysis
VALUE Offer - $1 for 2 Weeks then $29 a month!Click here
Access 7 Analysts Over 200 Markets Covered. Chat Room With Support