20Jun

VeChain Elliott Wave Analysis Signals Possible Wave III Breakout from Support: VETUSD Trading Strategy for Crypto Traders

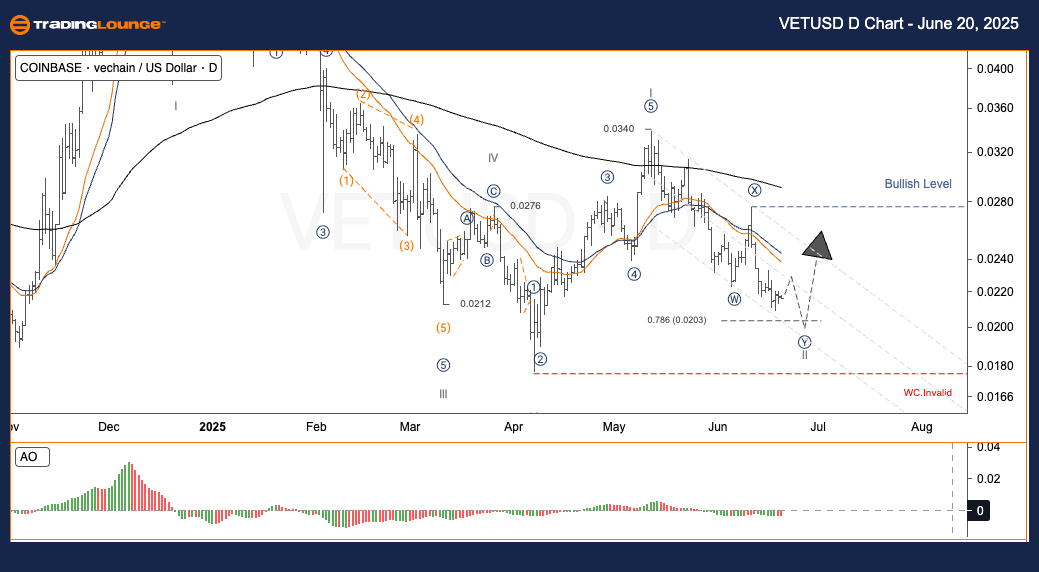
VeChain (VET) to US Dollar (USD) – VETUSD Elliott Wave Analysis – TradingLounge Daily Chart

VETUSD Elliott Wave Technical Forecast

Function: Counter-Trend Movement

Mode: Corrective Phase

Structure: Double Correction Pattern

Current Position: Wave Y

Next Major Direction: To Be Confirmed

Invalidation Level for Wave Count: Under Review

VeChain (VETUSD) – Daily Trading Strategy

The VET/USD pair is approaching the final leg of Wave II within its corrective formation. Should the price move into the 0.020–0.018 zone and then produce a swift upside reaction, it may mark the beginning of a bullish impulsive Wave III.

Trading Strategies:

  • General Outlook

Short-Term Traders (Swing Strategy):

✅ Track momentum indicators like RSI and MACD for divergence signals. Ensure no new confirmed lows form.

✅ Look for bullish reversal candlestick patterns, such as Bullish Engulfing, accompanied by increasing volume before entering long trades.

  • Risk Management:

🟥 If VETUSD falls beneath the 0.01700 level, it invalidates the current Wave II structure and requires reassessment.

VETUSD-day-Crypto-Ch...


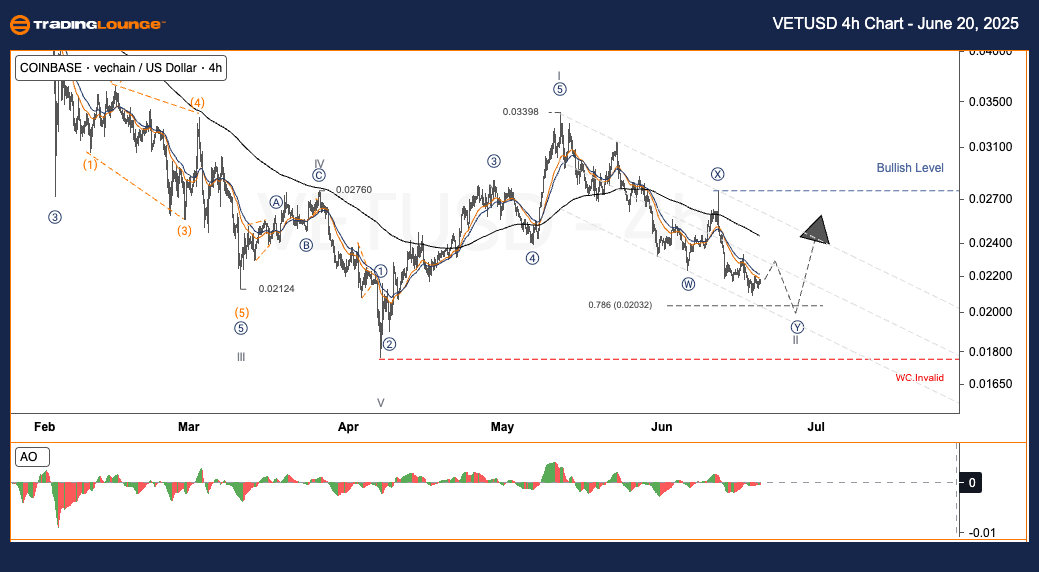
VeChain (VET) to US Dollar (USD) – VETUSD Elliott Wave Analysis – TradingLounge 4-Hour Chart

VETUSD Elliott Wave Technical Forecast

Function: Counter-Trend Structure

Mode: Ongoing Correction

Structure: Double Corrective Pattern

Current Position: Wave Y

Next Directional Move: Awaiting Confirmation

Wave Invalidation Level: Under Review

VeChain (VETUSD) – H4 Trading Strategy

The VET/USD price continues to unfold within the final stages of corrective Wave II. A pullback toward the 0.020–0.018 support area, followed by a strong rebound, could confirm the launch of bullish Wave III.

Trading Strategies:

  • General Approach

Swing Traders:

✅ Watch RSI and MACD indicators for signs of divergence while confirming that no new major lows appear.

✅ Entry signals may come from clear bullish reversal candles supported by high trading volume.

  • Risk Management:

🟥 A drop below 0.01700 invalidates this wave count, necessitating a fresh analysis.

Technical Analyst: Kittiampon Somboonsod, CEWA

Source: Visit Tradinglounge.com and learn from the Experts. Join TradingLounge Here

Previous: XRPUSD Elliott Wave Technical Analysis

VALUE Offer - $1 for 2 Weeks then $29 a month!Click here

Access 7 Analysts Over 200 Markets Covered. Chat Room With Support

VETUSD-4h-Crypto-Cha...

Related

Elliott Wave Analysis of Dow Jones (DJI): Insights on Corrective Phase with Orange Wave B and Navy Blue Wave 4 Trends

Elliott Wave Analysis of Dow Jones (DJI): Insights on Corrective Phase with Orange Wave B and Navy Blue Wave 4 Trends

The Dow Jones Industrial Average (DJI) using Elliott Wave Theory highlights the progression of orang...

Read More >
DIS Elliott Wave Analysis: Identifying Trading Opportunities for The Walt Disney Company (DIS)

DIS Elliott Wave Analysis: Identifying Trading Opportunities for The Walt Disney Company (DIS)

DIS Elliott Wave Analysis for The Walt Disney Company (DIS), reveals potential for both bullish and ...

Read More >
ITC INDIA Stock's Bullish Momentum: Elliott Wave Analysis Reveals Key Trends, Wave Counts, and Investment Opportunities Ahead

ITC INDIA Stock's Bullish Momentum: Elliott Wave Analysis Reveals Key Trends, Wave Counts, and Investment Opportunities Ahead

ITC's stock performance through the lens of Elliott Wave Theory, highlighting a bullish trend wi...

Read More >
AAVE/ U.S. dollar(AAVEUSD) Elliott Wave Technical Analysis : Unlocking Profitable AAVE/USD Trading Strategies

AAVE/ U.S. dollar(AAVEUSD) Elliott Wave Technical Analysis : Unlocking Profitable AAVE/USD Trading Strategies

Dive deep into the world of AAVE/USD trading with our expert Elliott Wave Analysis. This guide provi...

Read More >
Binance Coin Crypto News Today: Elliott Wave Technical Analysis of BNB/USD Navigating the Bullish Momentum

Binance Coin Crypto News Today: Elliott Wave Technical Analysis of BNB/USD Navigating the Bullish Momentum

Dive into the world of cryptocurrency with our detailed Elliott Wave analysis of BNB/USD. This guide...

Read More >
NEOUSD Elliott Wave Analysis: Predicting NEO Price, Identifying Key Support/Resistance Levels, and Strategic Trading Opportunities

NEOUSD Elliott Wave Analysis: Predicting NEO Price, Identifying Key Support/Resistance Levels, and Strategic Trading Opportunities

This article provides an in-depth Elliott Wave analysis of NEOUSD, highlighting potential price move...

Read More >

$1 for 2 Weeks

then $29 a month!

What a Special Offer!

Trade Recommendations

Unleash the power of deversified trading with our comprehensive portfolio, covering 250+ markets:

  • Stock Trades
  • Crypto Trades
  • Forex Trades
  • Commodity Trades
Elliott Wave Analysis

Gain a competitive edge with expert insights and AI-powered Elliott Wave charting into:

  • Global Indices
  • US Stocks & ASX Stocks
  • Forex & Crypto
  • Commodities
Top-Notch Trading Tools

Equip yourself with the tools of success:

  • Real-time Chat rooms
  • Elliott Wave Algorithm
  • Portfolio tools
  • TradingLevels
  • Screener
  • Trading Game
7 Elliott Wave Analysts

Stay ahead of the market with daily charts and insightful videos
Your secret to strategic trading!

JOIN HERE


Welcome to TradingLounge (ASIC A.R.No. 321187), specialists in trades, trading education and technical analysis, covering stocks, indices, commodities, forex and cryptocurrencies.

When you join TradingLounge you have access to everything we offer, including trade tools, educational content and a social platform to chat with like-minded investors.

Read more

@Copyright 2024 by tradinglounge.com

Contact Us

Australian no: 02 4787 6020

International no: +61 (2) 47876020

Pay with:

Find us on