07Mar

JAMES HARDIE INDUSTRIES PLC (JHX) Elliott Wave Analysis: ASX JHX Stock Forecast, and Technical Analysis for Smart Traders

JAMES HARDIE INDUSTRIES PLC (JHX) Elliott Wave Technical Analysis TradingLounge

Introduction

Our latest Elliott Wave analysis provides an updated outlook on the Australian Stock Exchange (ASX), with a specific focus on JAMES HARDIE INDUSTRIES PLC (JHX).

Current market conditions suggest that ASX:JHX shares may continue their downtrend in the medium term. Given the prevailing risks, traders should exercise caution when considering a long strategy. This analysis highlights critical price levels and market trends, offering a structured and data-driven approach to forecasting.


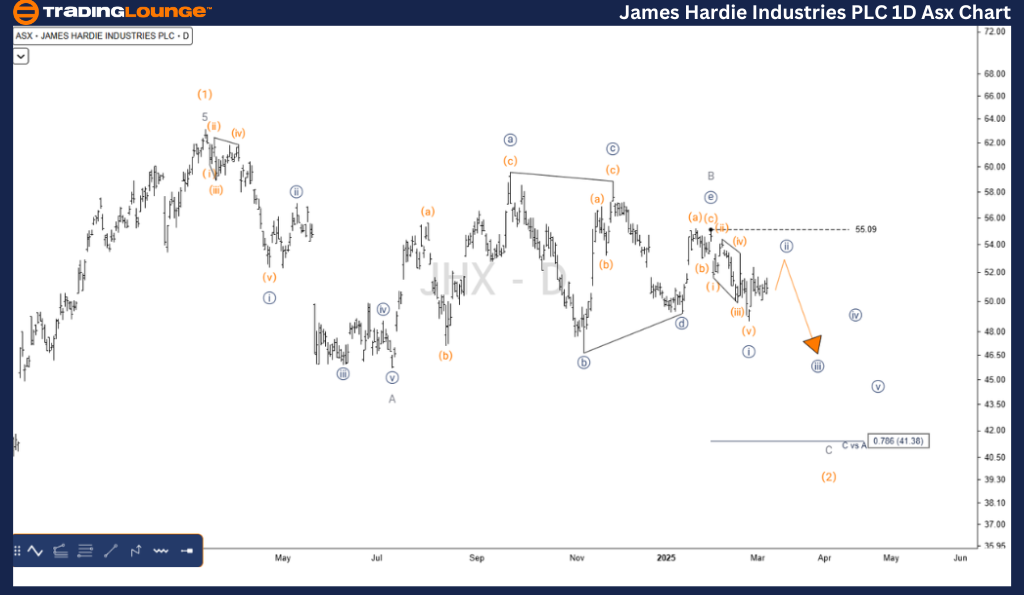
JAMES HARDIE INDUSTRIES PLC (JHX) Elliott Wave Technical Analysis - 1D Chart

JHX Elliott Wave Technical Analysis

Function: Major Trend (Intermediate Degree, Orange)

Mode: Motive

Structure: Impulse

Position: Wave C - Grey of Wave (2) - Orange

Key Insights:

  • Wave (2) - Orange is still developing as a Zigzag and may not yet be complete.
  • Recent price action suggests a sideways movement, forming a Triangle labeled Wave B - Grey.
  • This Triangle pattern has recently concluded, opening the way for Wave C - Grey to move lower, potentially breaking the 49.16 USD level, confirming the bearish outlook.

Key Price Levels:

  • Invalidation Point: 55.09 USD
  • Key Support Level: 49.16 USD

JAMES-HARDIE-1d-asx-...


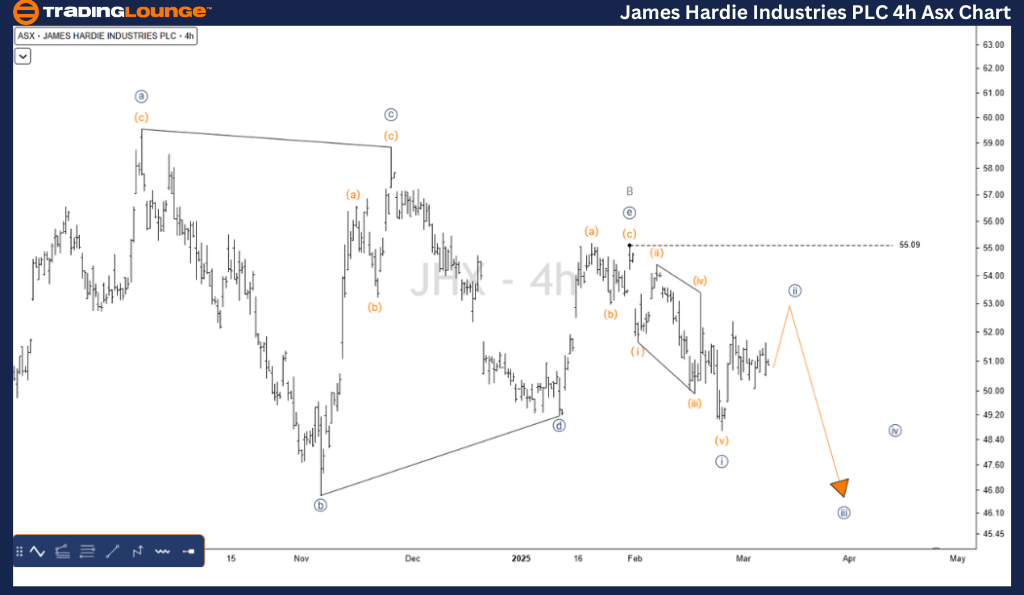
JAMES HARDIE INDUSTRIES PLC (JHX) Elliott Wave Technical Analysis - 4-Hour Chart

JHX Elliott Wave Technical Analysis

Function: Major Trend (Intermediate Degree, Orange)

Mode: Motive

Structure: Impulse

Position: Wave ((ii)) - Navy of Wave C - Grey of Wave (2) - Orange

Key Insights:

  • A closer analysis shows that Wave ((e)) - Navy of Wave B - Grey has recently completed a three-wave Zigzag, peaking at 55.09 USD.
  • Market behavior indicates a bearish sentiment, suggesting that further downward movement is highly likely.

Key Price Levels:

  • Invalidation Point: 55.09 USD
  • Key Support Level: 49.16 USD

Technical Analyst: Hua (Shane) Cuong, CEWA-M (Master’s Designation).

Source: visit Tradinglounge.com and learn From the Experts Join TradingLounge Here 

See Previous: NEWMONT CORPORATION (NEM) Elliott Wave Technical Analysis

VALUE Offer - Buy 1 Month & Get 3 Months!Click here

Access 7 Analysts Over 200 Markets Covered. Chat Room With Support

JAMES-HARDIE-4h-asx-...


Conclusion

Our Elliott Wave analysis of JAMES HARDIE INDUSTRIES PLC (JHX) provides valuable insights into market trends and potential trading opportunities. By identifying validation and invalidation price points, traders can confidently approach Elliott Wave projections. This structured methodology ensures an objective and professional perspective on market movements, enabling traders to make informed decisions.

Related

S&P/TSX 60 Elliott Wave Analysis: Market Trends, Trading Signals & Price Forecast for Optimized Investment Strategies

S&P/TSX 60 Elliott Wave Analysis: Market Trends, Trading Signals & Price Forecast for Optimized Investment Strategies

S&P/TSX 60 Elliott Wave analysis provides an in-depth look at the current corrective phase within th...

Read More >
Netflix Inc. (NFLX) Elliott Wave Technical Analysis: Investment Insights, Financial Performance, and Growth Potential for 2025

Netflix Inc. (NFLX) Elliott Wave Technical Analysis: Investment Insights, Financial Performance, and Growth Potential for 2025

Netflix Inc. (NFLX) with our comprehensive stock analysis. This report covers key financial performa...

Read More >
Apple Inc.(AAPL:NASDAQ) Elliott Wave Technical Analysis 12 December 23

Apple Inc.(AAPL:NASDAQ) Elliott Wave Technical Analysis 12 December 23

Apple Inc. (AAPL: NASDAQ) Elliott Wave Technical Analysis dated 12 December 23, Elliott Wave Analysi...

Read More >
ChainLink/U.S. dollar(LINKUSD) Elliott Wave Technical Analysis 24 January 24

ChainLink/U.S. dollar(LINKUSD) Elliott Wave Technical Analysis 24 January 24

ChainLink and U.S. dollar Elliott Wave Technical Analysis dated 24 January 24 in which TradingLounge...

Read More >
Johnson & Johnson (JNJ) Elliott Wave Analysis: Understanding the Trend Direction and Potential Price Movements

Johnson & Johnson (JNJ) Elliott Wave Analysis: Understanding the Trend Direction and Potential Price Movements

Explore the Elliott Wave analysis for Johnson & Johnson (JNJ) focusing on trend direction and price ...

Read More >
Boost your Trading with NIFTY 50 (INDIA) Elliott Wave Technical Analysis Help Market Prediction and the best Strategies

Boost your Trading with NIFTY 50 (INDIA) Elliott Wave Technical Analysis Help Market Prediction and the best Strategies

Stay ahead in the market with our comprehensive NIFTY 50 trading analysis. Utilizing Elliott Wave th...

Read More >

Buy 1 Month

Get 3 Months!

Special Offer:

Trade Recommendations

Unleash the power of deversified trading with our comprehensive portfolio, covering:

  • Stock Trades
  • Crypto Trades
  • Forex Trades
  • Commodity Trades
Elliott Wave Analysis

Gain a competive edge with expert insights in to:

  • Global Indices
  • US Stocks & ASX Stocks
  • Forex & Crypto
  • Commodities
Top-Notch Trading Tools

Equip yourself with the tools of success:

  • Social Chat
  • Elliott Wave Algorithm
  • Screener
  • TradingLevels
  • Trading Game
7 Elliott Wave Analysts

Stay ahead of the market with daily charts and insightful videos
-Your secret to strategic trading!

JOIN HERE


Welcome to TradingLounge (ASIC A.R.No. 321187), specialists in trades, trading education and technical analysis, covering stocks, indices, commodities, forex and cryptocurrencies.

When you join TradingLounge you have access to everything we offer, including trade tools, educational content and a social platform to chat with like-minded investors.

Read more

@Copyright 2024 by tradinglounge.com

Contact Us

Australian no: 02 4787 6020

International no: +61 (2) 47876020

Pay with:

Find us on