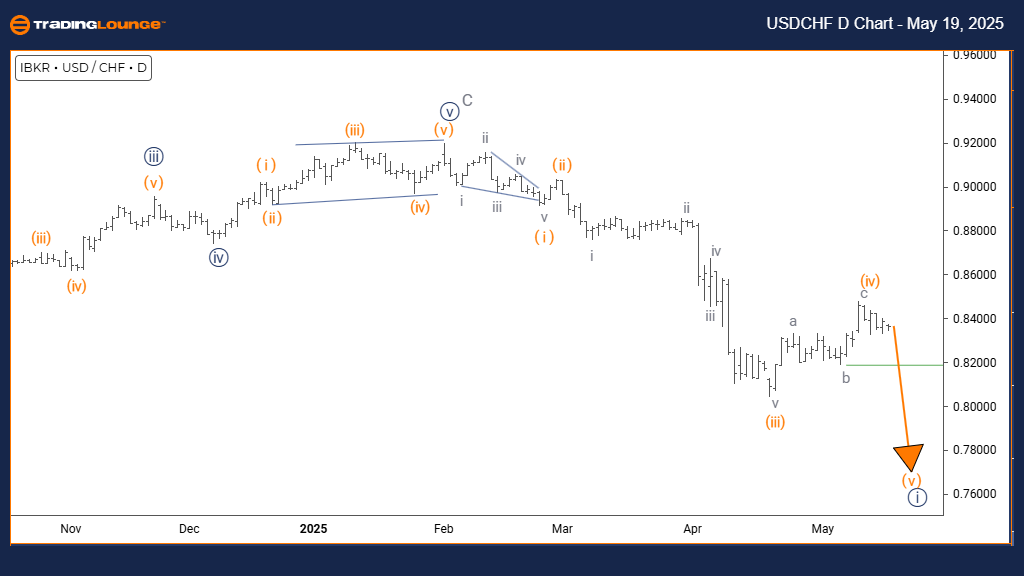
U.S. Dollar / Swiss Franc (USDCHF) Elliott Wave Analysis – Trading Lounge Daily Chart
USDCHF Elliott Wave Technical Outlook
FUNCTION: Bearish Price Action
MODE: Impulsive Wave Structure
STRUCTURE: Developing Navy Blue Wave 1
POSITION: Incomplete Gray Wave 1
NEXT HIGHER DEGREE DIRECTION: Formation of Navy Blue Wave 2
DETAILS: The internal Navy Blue Wave 1 of the broader Gray Wave 1 structure is still unfolding and nearing potential completion.
The USDCHF daily chart displays a defined bearish Elliott Wave structure. Currently, Navy Blue Wave 1 is progressing within Gray Wave 1, suggesting this decline is likely the initial stage of a broader bearish trend. The wave pattern implies continued downside risk in the near term as this impulsive wave develops.
Technical evidence continues to confirm that Navy Blue Wave 1 remains in progress, although it is approaching its terminal phase. The impulsive nature of this wave highlights ongoing strong selling interest. Upon completion, a transition into a corrective phase—Navy Blue Wave 2—is expected, offering a potential short-term retracement within an overall bearish market structure.
This Elliott Wave setup provides critical insights into the current market context for USDCHF. The positioning implies a minor upward correction may follow this downtrend. Traders should remain alert for confirmation signals indicating Wave 1 exhaustion, which may trigger the beginning of corrective Wave 2.
The analysis aids in applying disciplined risk management by recognizing the possibility of either continued losses under Wave 1 or a temporary upward pullback under Wave 2. Traders must monitor for valid wave shift indicators while staying aware of the prevailing bearish macrostructure.
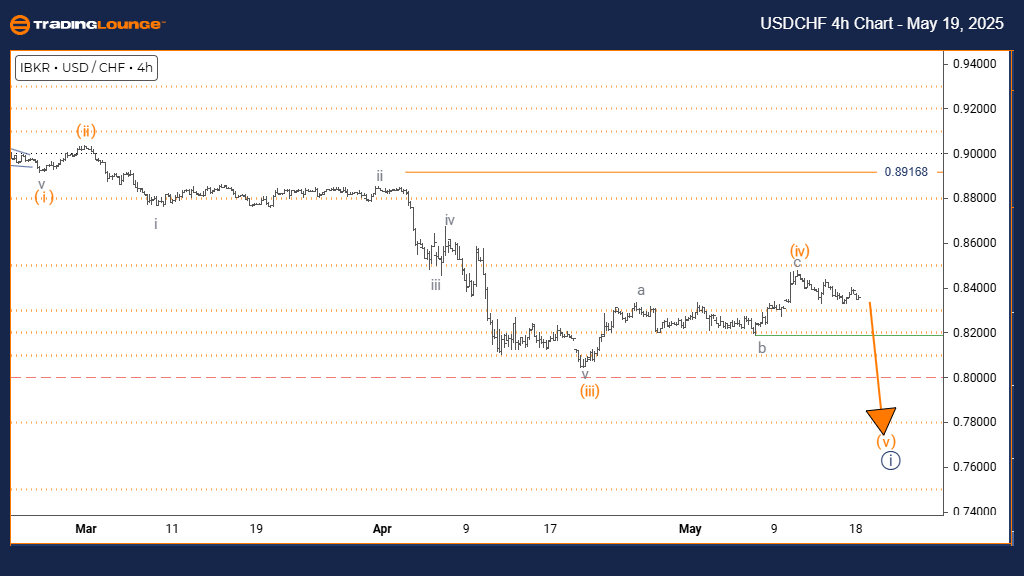
U.S. Dollar / Swiss Franc (USDCHF) Elliott Wave Analysis – Trading Lounge 4-Hour Chart
USDCHF Elliott Wave Technical Outlook
FUNCTION: Sustained Bearish Momentum
MODE: Impulsive Decline
STRUCTURE: Progressing Orange Wave 5
POSITION: Active Navy Blue Wave 1
NEXT LOWER DEGREE DIRECTION: Development of Orange Wave 5
DETAILS: Orange Wave 4 has finalized; Orange Wave 5 is now active.
INVALIDATION LEVEL: 0.89168
The 4-hour USDCHF chart reflects a continuation of bearish pressure. The wave analysis shows that Orange Wave 5 is advancing within Navy Blue Wave 1, signaling that Orange Wave 4 has completed. This pattern typically represents the last bearish phase before a corrective turn or consolidation.
Current technical readings validate that Orange Wave 5 is unfolding with strong downward momentum. This continuation pattern fits within Navy Blue Wave 1, indicating that the bearish leg may not yet be exhausted. A breach above 0.89168 would invalidate this current wave interpretation and call for reassessment.
This wave positioning offers traders actionable insights for short-selling opportunities with tight risk control. As Orange Wave 5 progresses, the chart structure suggests watching for early signs of wave exhaustion, which may precede a possible reversal or correction.
The technical structure supports ongoing downside potential, underlined by critical levels that help validate the bearish scenario. As long as the price remains below the invalidation threshold, the Elliott Wave count favors the bearish trend continuation. This structured analysis helps traders refine entry points and manage trade exposure effectively.
Technical Analyst: Malik Awais
Source: Visit Tradinglounge.com and learn from the Experts. Join TradingLounge Here
Previous: GBPUSD Elliott Wave Technical Analysis
VALUE Offer - Buy 1 Month & Get 3 Months!Click here
Access 7 Analysts Over 200 Markets Covered. Chat Room With Support