Polkadot / U.S. Dollar (DOTUSD) Elliott Wave Analysis - TradingLounge Daily Chart
DOTUSD Elliott Wave Technical Analysis
Function: Follow Trend
Mode: Motive
Structure: Impulse
Position: Wave V
Direction Next Higher Degrees: —
Wave Cancel Invalid Level: —
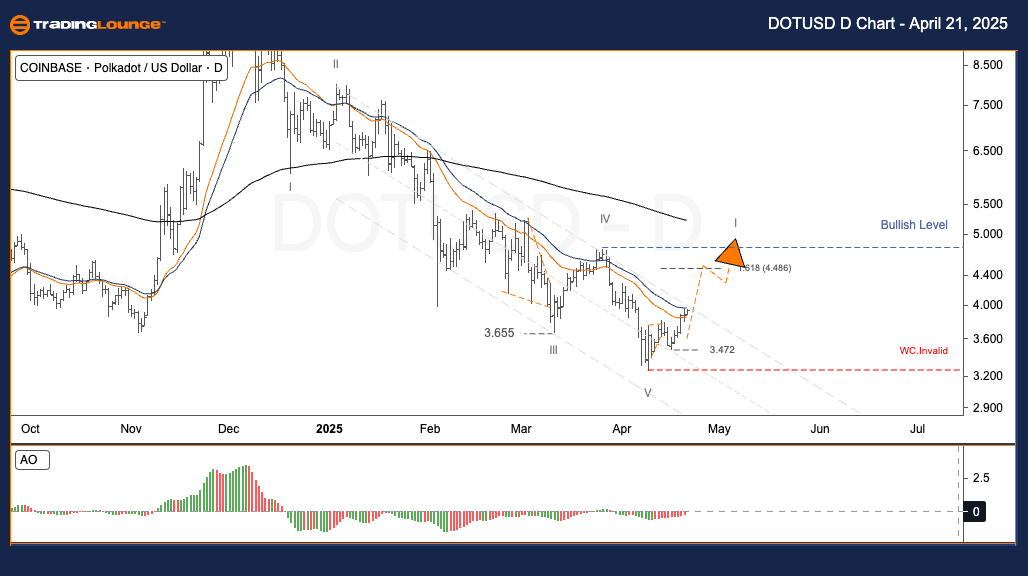
Polkadot / U.S. Dollar (DOTUSD) Daily Trading Strategy:
Polkadot (DOTUSD) has completed a 5-wave bearish decline from $11.653 to $3.472, marking the end of Wave I–V. A bullish trend reversal is now underway, supported by the emergence of a new Wave I. This wave is approaching key resistance at $4.486. A confirmed breakout above this level can validate the setup for Wave II and initiate a powerful Wave III advance—historically the strongest phase in an Elliott Wave cycle.
Trading Strategies
Strategy
✅ Short-Term Traders (Swing Trade)
- Monitor for Wave II retracement
- Prepare long positions at the onset of Wave III
Risk Management: —
Polkadot / U.S. Dollar (DOTUSD) Elliott Wave Analysis - TradingLounge H4 Chart
DOTUSD Elliott Wave Technical Analysis
Function: Follow Trend
Mode: Motive
Structure: Impulse
Position: Wave 3
Direction Next Higher Degrees: —
Wave Cancel Invalid Level: —
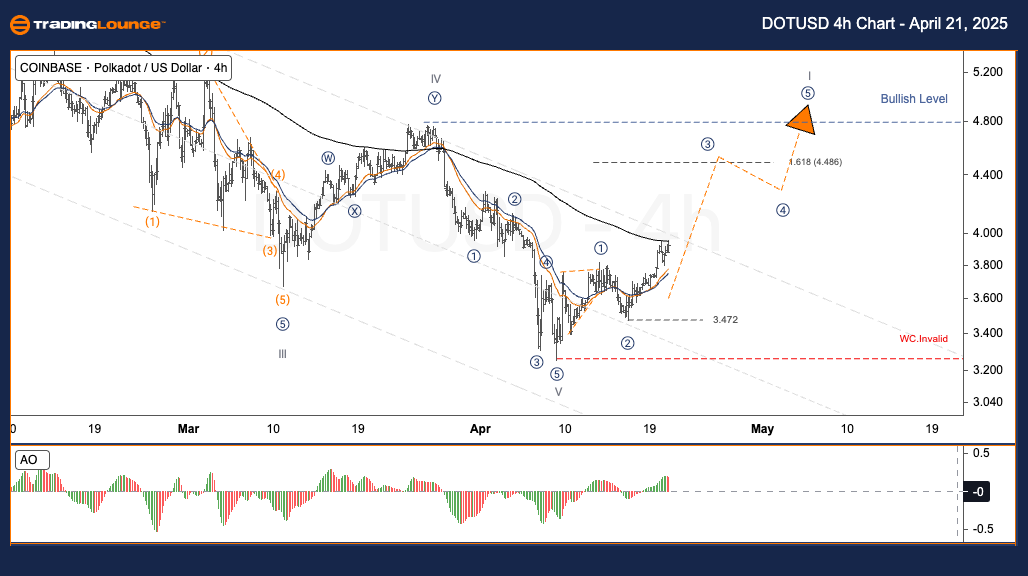
Polkadot / U.S. Dollar (DOTUSD) Intraday Trading Strategy:
Following the Wave V bottom at $3.472 on the Daily chart, DOTUSD has started a new uptrend with Wave I in play. On the H4 timeframe, the market is currently unfolding Wave 3 of Wave I. The next resistance aligns with the 1.618 Fibonacci extension near $4.486—an important level for bullish momentum continuation.
Trading Strategies
Strategy
✅ Short-Term Traders (Swing Trade)
- Trade with the momentum in Wave 3
- Anticipate Wave 4 pullback to set up for Wave 5 entries
Risk Management: —
Technical Analyst: Kittiampon Somboonsod, CEWA
Source: Visit Tradinglounge.com and learn from the Experts. Join TradingLounge Here
Previous: AAVEUSD Elliott Wave Technical Analysis
VALUE Offer - Buy 1 Month & Get 3 Months!Click here
Access 7 Analysts Over 200 Markets Covered. Chat Room With Support