SEIUSD Elliott Wave Analysis - TradingLounge Daily Chart, SEI/USD

SEI/USD Daily Chart Analysis

SEIUSD Elliott Wave Technical Overview

Function: Trend Continuation

Mode: Motive

Structure: Impulse Pattern

Current Position: Wave V

Higher Degree Direction: Wave C within a Flat Pattern

Invalidation Level for Wave Count:

SEI/USD Trading Strategy - Daily Chart Insight

The SEI/USD pair recently gained upward momentum. Based on the Elliott Wave Analysis, the cryptocurrency is now in a corrective phase, following an (A)-(B)-(C) wave structure. Currently, Wave C is active and moving through its fifth sub-wave (Wave 5), which appears to be reaching its final stage. This segment is pushing downward.

Wave 5 Target: Projected near the base of Wave 1, approximately at the 0.1094 price level.

SEI/USD Trading Strategies

Primary Strategy

Swing Traders (Short-Term Outlook)

Watch Zone: 0.109 – 0.12
Monitor price activity within this key area. If a bullish divergence or reversal candlestick pattern appears, it could mark the conclusion of Wave C and the initiation of a potential bullish trend.

Risk Management

Critical Resistance Level: 0.2300
Should the price climb above this level, it would invalidate the existing Elliott Wave structure and require a reassessment of the market count.

SEIUSD-Crypto-Day-Ch...


SEIUSD Elliott Wave Analysis - TradingLounge H4 Chart, SEI/USD

SEIUSD Elliott Wave Technical Overview

Function: Trend Continuation

Mode: Motive

Structure: Impulse Pattern

Current Position: Wave V

Higher Degree Direction: Wave C within a Flat Pattern

Invalidation Level for Wave Count: —

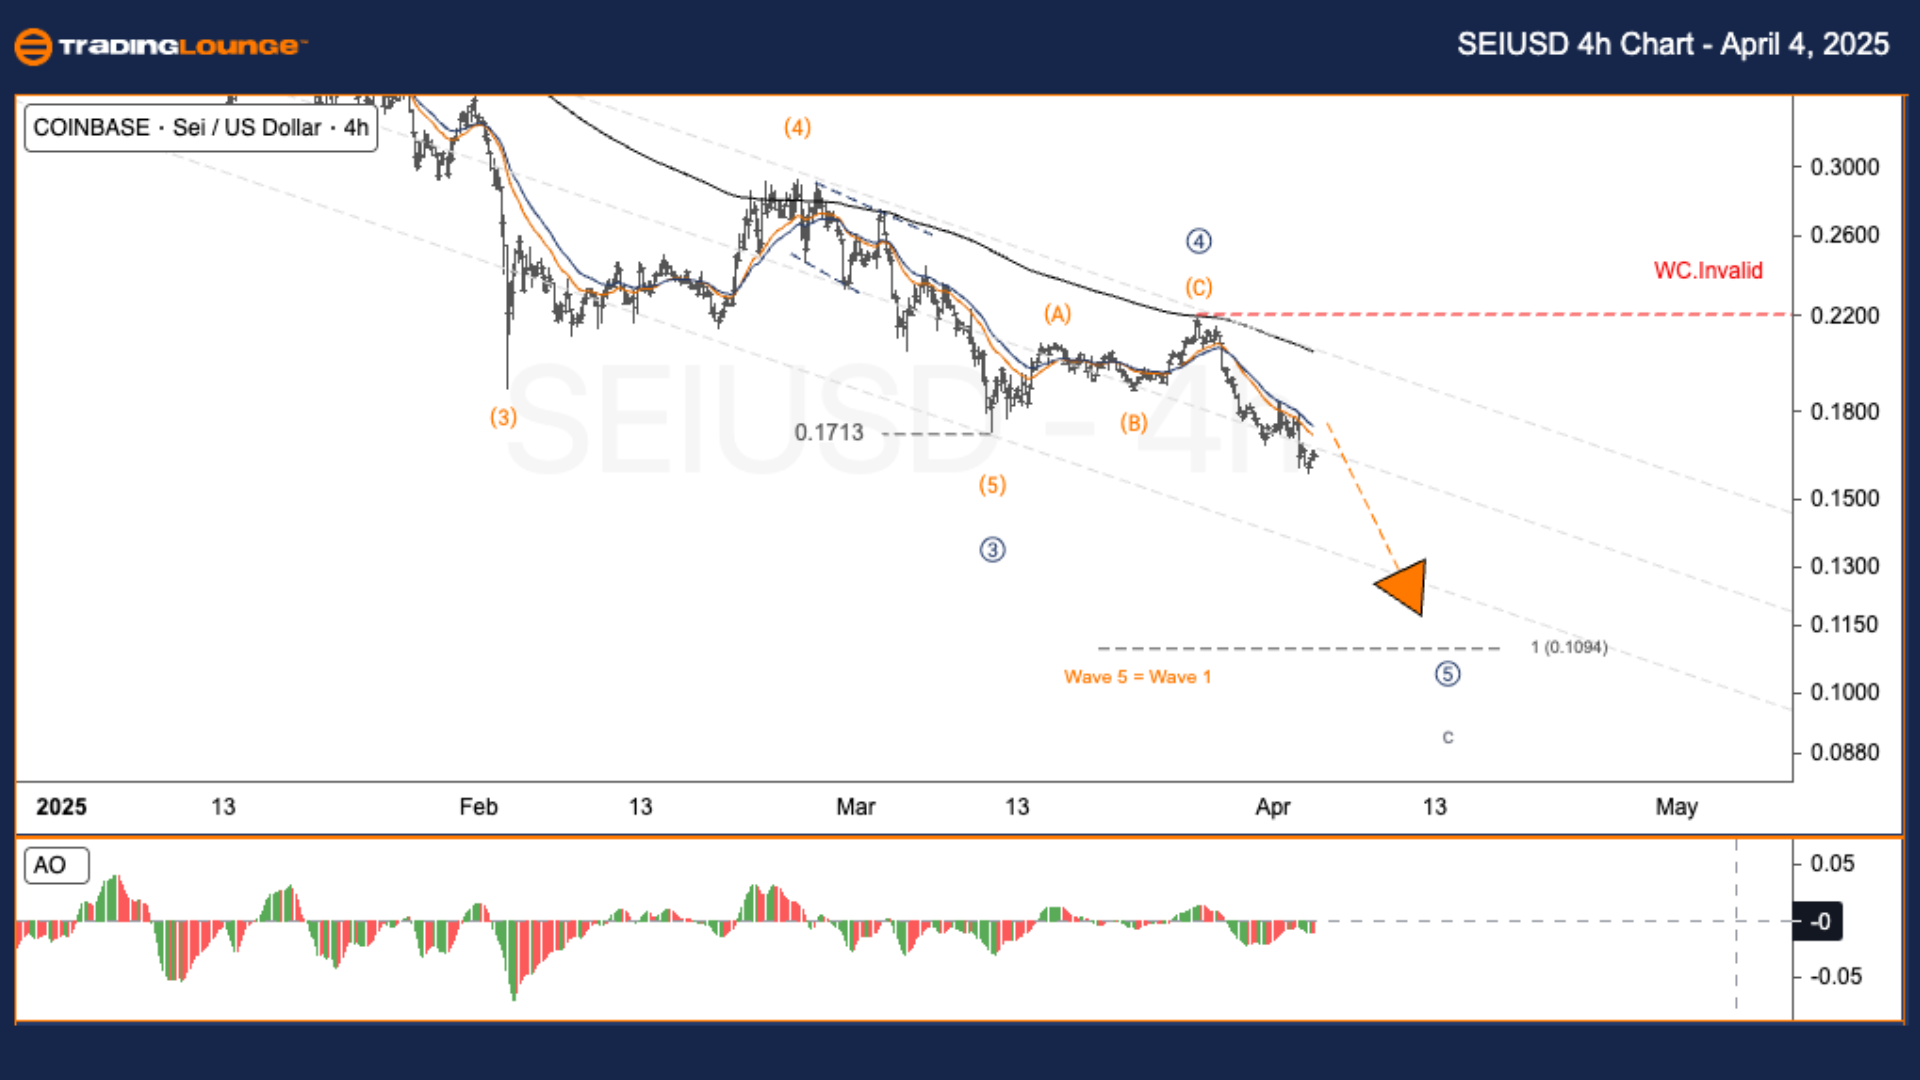
SEI/USD Trading Strategy - 4-Hour Chart Insight

Following a strong upward rally, SEIUSD is currently engaged in a three-wave correction labeled (A)-(B)-(C). Wave C is active and appears to be within its final leg — Wave 5 — which is continuing its descent.

  • Wave 5 Target: Projected near 0.1094, aligning with the termination of Wave 1.

Trading Strategies

Primary Strategy

Swing Traders (Short-Term View)

✅ Watch Zone: 0.109 – 0.12
Be alert for reversal signs or bullish divergence within this range. Such patterns could indicate the conclusion of Wave C and suggest a reversal may occur.

Risk Management

Invalidation Resistance Level: 0.2300

A break above this threshold would nullify the current wave outlook and require a reevaluation of the Elliott Wave count.

Technical Analyst: Kittiampon Somboonsod, CEWA

Source: Visit Tradinglounge.com and learn from the Experts. Join TradingLounge Here 

Previous: ADA / U.S. Dollar (ADAUSD) Elliott Wave Technical Analysis

VALUE Offer - Buy 1 Month & Get 3 Months!Click here

Access 7 Analysts Over 200 Markets Covered. Chat Room With Support

SEIUSD-Crypto-4H-Cha...

Related

Gold XAUUSD Commodity Elliott Wave Analysis: Explore the Current Price Trends, Wave Structures, and Future Projections

Gold XAUUSD Commodity Elliott Wave Analysis: Explore the Current Price Trends, Wave Structures, and Future Projections

In this comprehensive Gold Elliott Wave Analysis, we explore the current price trends, wave structur...

Read More >
Newmont Corporation (ASX:NEM) Elliott Wave Stock Analysis Reveals Bullish Wave 3 With Price Targets of $100 and $102.37

Newmont Corporation (ASX:NEM) Elliott Wave Stock Analysis Reveals Bullish Wave 3 With Price Targets of $100 and $102.37

Elliott Wave analysis on Newmont Corporation (ASX:NEM) reveals a strong bullish trend in Wave 3 with...

Read More >
Elliott Wave Analysis for DOTUSD: Technical Insights, Trading Strategies, and Bullish Trend Forecast

Elliott Wave Analysis for DOTUSD: Technical Insights, Trading Strategies, and Bullish Trend Forecast

This article provides an in-depth Elliott Wave Analysis for DOT/USD (DOTUSD), highlighting price pre...

Read More >
British Pound/ Australian Dollar(GBPAUD) Elliott Wave Technical Analysis 28 November 23

British Pound/ Australian Dollar(GBPAUD) Elliott Wave Technical Analysis 28 November 23

GBPAUD Elliott Wave Analysis Trading Lounge Day Chart" dated 28 November 23, provides an insigh...

Read More >
META Stock Set to Soar: Meta Platforms Inc Elliott Wave Technical Analysis Reveals Key Targets and Trading Opportunities

META Stock Set to Soar: Meta Platforms Inc Elliott Wave Technical Analysis Reveals Key Targets and Trading Opportunities

This article provides an in-depth Elliott Wave analysis of Meta Platforms (META) stock, covering its...

Read More >

$1 for 2 Weeks

then $29 a month!

What a Special Offer!

Trade Recommendations

Unleash the power of deversified trading with our comprehensive portfolio, covering 250+ markets:

  • Stock Trades
  • Crypto Trades
  • Forex Trades
  • Commodity Trades
Elliott Wave Analysis

Gain a competitive edge with expert insights and AI-powered Elliott Wave charting into:

  • Global Indices
  • US Stocks & ASX Stocks
  • Forex & Crypto
  • Commodities
Top-Notch Trading Tools

Equip yourself with the tools of success:

  • Real-time Chat rooms
  • Elliott Wave Algorithm
  • Portfolio tools
  • TradingLevels
  • Screener
  • Trading Game
7 Elliott Wave Analysts

Stay ahead of the market with daily charts and insightful videos
Your secret to strategic trading!

JOIN HERE


Welcome to TradingLounge (ASIC A.R.No. 321187), specialists in trades, trading education and technical analysis, covering stocks, indices, commodities, forex and cryptocurrencies.

When you join TradingLounge you have access to everything we offer, including trade tools, educational content and a social platform to chat with like-minded investors.

Read more

@Copyright 2024 by tradinglounge.com

Contact Us

Australian no: 02 4787 6020

International no: +61 (2) 47876020

Pay with:

Find us on