TradingLounge WTI Crudeoil Commodity Elliott Wave Analysis

WTI Crudeoil Elliott Wave Technical Analysis

As we near the end of September 2024, WTI oil prices are experiencing a retracement following the sell-off that began in late June. While this retracement might continue, the overall long-term bearish cycle is expected to push prices below the lows of May 2023, with the potential to revisit levels last seen in mid-2021.

From a broader perspective, WTI is in a bearish corrective phase. After rebounding from the COVID-19 downturn in April 2020, WTI prices surged for 23 months, culminating in an impulse wave peak in March 2022, when prices exceeded $130. Since then, WTI has entered a bearish phase, which we now classify as a corrective cycle.

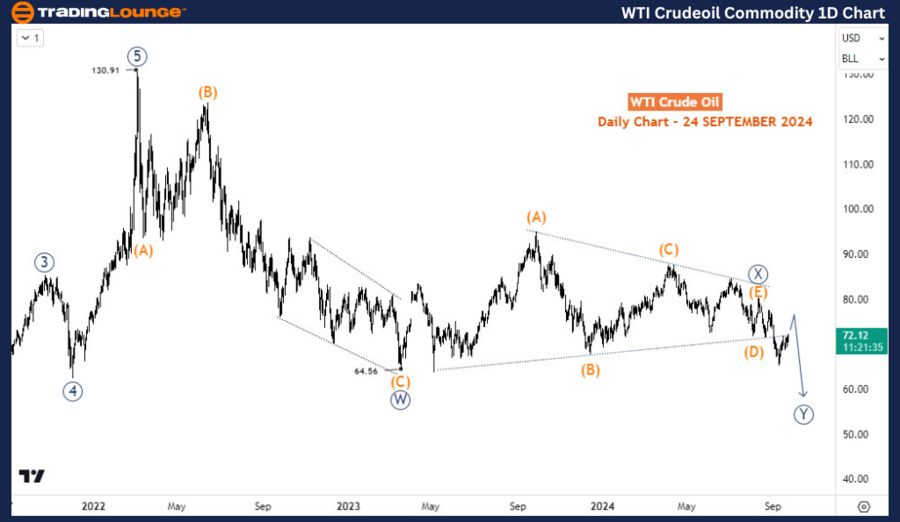
WTI Crudeoil Commodity Daily Chart Analysis

A closer look at the daily chart reveals that the corrective cycle since March 2022 is developing into a double zigzag pattern. After completing a zigzag at $64.50 in March 2023, prices have moved sideways for over 17 months, indicating the possibility of a larger double zigzag formation that could drive prices below $50 in the upcoming months.

The first leg of this pattern completed a zigzag structure, labeled wave W (circled) in the primary degree. The second leg formed a triangle structure, identified as wave X (circled). In early September, prices broke out of the triangle, signaling the start of the third leg—wave Y (circled). The current bounce appears to be a minor correction within the larger wave Y (circled) decline.

WTI-Crudeoil-Commodi...


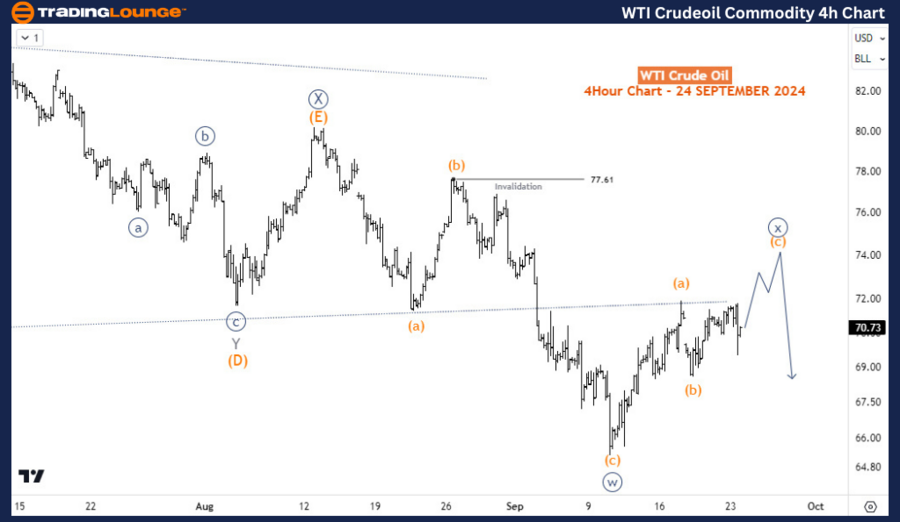
WTI Crudeoil Commodity 4-hour Chart Analysis

On the H4 chart, wave Y (circled) began after the high on August 13, 2024, at $80.16, where wave X (circled) concluded with a triangle pattern. The ongoing bounce could extend toward the $74-$76 range to complete wave x (circled) of W, a sub-wave of Y (circled). As long as this bounce remains below $80.16, the long-term outlook for WTI continues to favor further downside movement.

Technical Analyst: Sanmi Adeagbo

Source: visit Tradinglounge.com and learn From the Experts Join TradingLounge Here 

See Previous: Coffee Elliott Wave Technical Analysis

VALUE Offer - Buy 1 Month & Get 3 Months!Click here

Access 7 Analysts Over 200 Markets Covered. Chat Room With Support

WTI-Crudeoil-Commodi...

Related

Comprehensive Mahindra & Mahindra Stock Analysis and Elliott Wave Forecast for Future Share Price Predictions

Comprehensive Mahindra & Mahindra Stock Analysis and Elliott Wave Forecast for Future Share Price Predictions

Explore Mahindra & Mahindra stock analysis with detailed Elliott Wave analysis, share price predicti...

Read More >
VeChain (VET) Elliott Wave Analysis Reveals Key Price Predictions and Strategic Trading Opportunities for Crypto Enthusiasts

VeChain (VET) Elliott Wave Analysis Reveals Key Price Predictions and Strategic Trading Opportunities for Crypto Enthusiasts

This article provides an in-depth Elliott Wave analysis of VeChain (VET), highlighting current marke...

Read More >
Commodity Market Elliott Wave Analysis: Insights on Bitcoin, Bonds, Yields, and More

Commodity Market Elliott Wave Analysis: Insights on Bitcoin, Bonds, Yields, and More

Unlocking Market Trends: Discover Elliott Wave Insights on Bitcoin, Bonds, Yields, and More. Stay Ah...

Read More >
Shanghai Composite Index Elliott Wave Forecast: Bullish Wave 3 Trend Explained with Daily and Weekly Chart Analysis

Shanghai Composite Index Elliott Wave Forecast: Bullish Wave 3 Trend Explained with Daily and Weekly Chart Analysis

Analyze Shanghai Composite Index using Elliott Wave theory. Learn about the bullish Wave 3 impulse a...

Read More >
Exxon Mobil Inc.(XOM) Stocks Elliott Wave Technical Analysis: Provides Traders with detailed insights

Exxon Mobil Inc.(XOM) Stocks Elliott Wave Technical Analysis: Provides Traders with detailed insights

Our latest Elliott Wave analysis for Exxon Mobil Inc. (XOM) provides traders with detailed insights ...

Read More >
Visa Inc.(V:NYSE) Elliott Wave Technical Analysis 23 November 23

Visa Inc.(V:NYSE) Elliott Wave Technical Analysis 23 November 23

Visa Inc.(V: NYSE) Elliott Wave Technical Analysis Dated 23 November 23 with 1Hr and 4Hr Chart,

Read More >

$1 for 2 Weeks

then $29 a month!

What a Special Offer!

Trade Recommendations

Unleash the power of deversified trading with our comprehensive portfolio, covering 250+ markets:

  • Stock Trades
  • Crypto Trades
  • Forex Trades
  • Commodity Trades
Elliott Wave Analysis

Gain a competitive edge with expert insights and AI-powered Elliott Wave charting into:

  • Global Indices
  • US Stocks & ASX Stocks
  • Forex & Crypto
  • Commodities
Top-Notch Trading Tools

Equip yourself with the tools of success:

  • Real-time Chat rooms
  • Elliott Wave Algorithm
  • Portfolio tools
  • TradingLevels
  • Screener
  • Trading Game
7 Elliott Wave Analysts

Stay ahead of the market with daily charts and insightful videos
Your secret to strategic trading!

JOIN HERE


Welcome to TradingLounge (ASIC A.R.No. 321187), specialists in trades, trading education and technical analysis, covering stocks, indices, commodities, forex and cryptocurrencies.

When you join TradingLounge you have access to everything we offer, including trade tools, educational content and a social platform to chat with like-minded investors.

Read more

@Copyright 2024 by tradinglounge.com

Contact Us

Australian no: 02 4787 6020

International no: +61 (2) 47876020

Pay with:

Find us on