10Dec

Achieving ASX Trading Success: AMCOR PLC (AMC) Stock Insights and Elliott Wave Technical Analysis

AMCOR PLC – AMC Elliott Wave Technical Analysis TradingLounge

Greetings, this analysis offers an updated Elliott Wave perspective on the Australian Stock Exchange (ASX) with AMCOR PLC – AMC. The analysis suggests ASX:AMC could push slightly lower in the short term before initiating a potential upward movement with a 3-grey wave pattern.


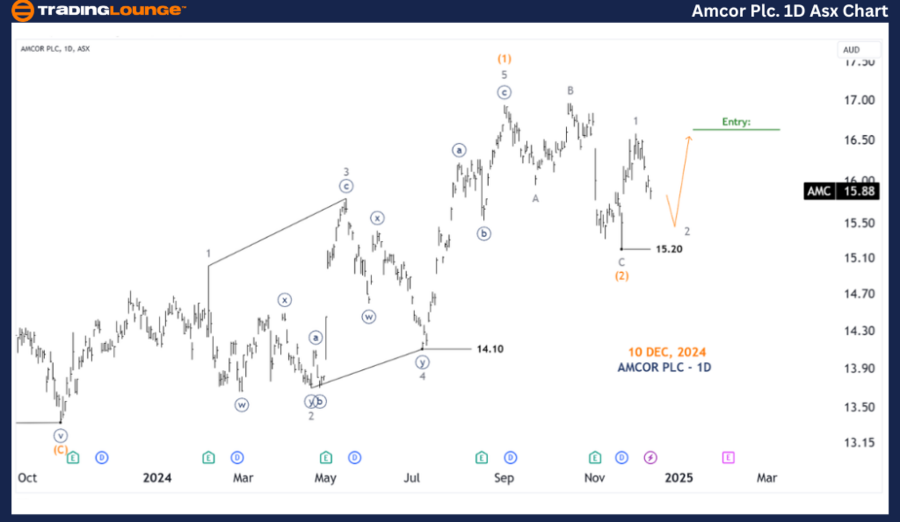
AMCOR PLC – AMC 1D Chart (Semilog Scale) Analysis

Function: Major trend (Intermediate degree)

Mode: Motive

Structure: Impulse

Position: Wave 2-grey of Wave (3)-orange

Details:

  • Wave 1-grey has concluded, and wave 2-grey appears to be dipping slightly lower.
  • Following this, wave 3-grey may resume an upward trajectory.
  • A pending buy position can be strategically placed at the peak of wave 1-grey.

Invalidation Point: 15.20

AMCOR-PLC-1d-asx-cha...


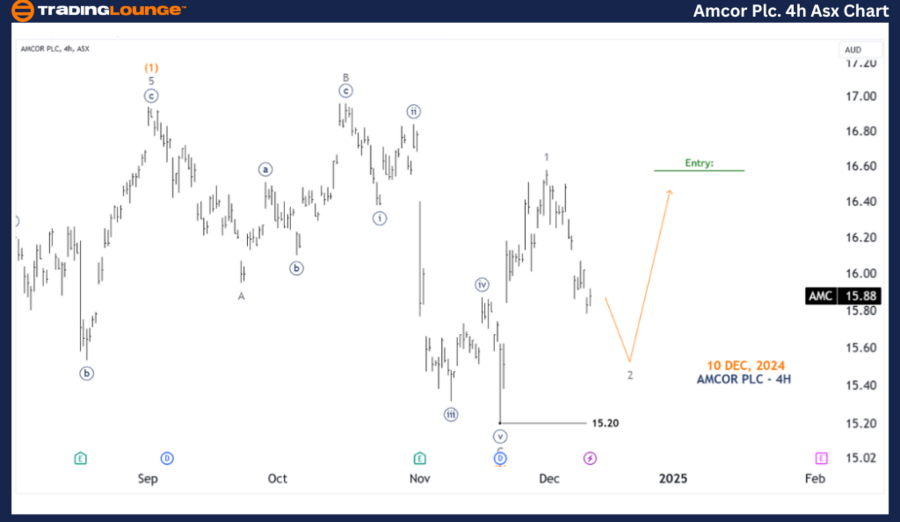
AMCOR PLC – AMC 4-Hour Chart Analysis

Function: Major trend (Minor degree, grey)

Mode: Motive

Structure: Impulse

Position: Wave 2-grey

Details:

  • Since the 15.20 low, wave 1-grey recently completed.
  • Wave 2-grey is currently moving slightly lower; as long as the price does not breach the 15.20 level, the projection of wave 3-grey returning upward remains valid.
  • A waiting buy position is advisable above the peak of wave 1-grey.

Invalidation Point: 15.20

Technical Analyst: Hua (Shane) Cuong, CEWA-M (Master’s Designation).

Source: visit Tradinglounge.com and learn From the Experts Join TradingLounge Here 

See Previous: ASX: WISETECH GLOBAL LIMITED - WTC Elliott Wave Technical Analysis  

VALUE Offer - Buy 1 Month & Get 3 Months!Click here

Access 7 Analysts Over 200 Markets Covered. Chat Room With Support

AMCOR-PLC-4h-asx-cha...


Conclusion

This analysis provides insights into AMCOR PLC – AMC’s Elliott Wave trends, offering actionable price points that act as validation or invalidation signals. These insights enable traders to approach market movements with greater confidence and precision. By leveraging key wave counts and critical levels, the analysis ensures an objective and professional perspective on market trends.

Related

U.S.Dollar/Swiss Franc(USDCHF) Elliott Wave Technical Analysis Chart 16 October 23

U.S.Dollar/Swiss Franc(USDCHF) Elliott Wave Technical Analysis Chart 16 October 23

U.S.Dollar/Swiss Franc(USDCHF) Elliott Wave Technical Analysis 16 October 23. offers a valuable reso...

Read More >
Eli Lilly & Co.(LLY:NYSE) Elliott Wave Technical Analysis 28 November 23

Eli Lilly & Co.(LLY:NYSE) Elliott Wave Technical Analysis 28 November 23

Eli Lilly & Co.(LLY:NYSE) Elliott Wave Technical Analysis dated 28 November 23 with 1-hour and 4-hou...

Read More >
Decline in wheat prices: understand the current market trends with Wheat Commodity Elliott Wave Technical Analysis

Decline in wheat prices: understand the current market trends with Wheat Commodity Elliott Wave Technical Analysis

Explore our comprehensive Wheat Elliott Wave Analysis to understand the current price forecast and m...

Read More >
Elliott Wave Analysis: S&P 500, NASDAQ 100, RUT, DAX 40, FTSE 100, ASX200 Trading Strategies

Elliott Wave Analysis: S&P 500, NASDAQ 100, RUT, DAX 40, FTSE 100, ASX200 Trading Strategies

In this Stock Market Report covering S&P 500, NASDAQ 100, RUSSELL 2000, DAX 40, FTSE 100, and ASX 20...

Read More >
Dr Reddy's Laboratories: Comprehensive Elliott Wave Analysis Reveals Bullish Trends and Key Support Levels for Strategic Trading

Dr Reddy's Laboratories: Comprehensive Elliott Wave Analysis Reveals Bullish Trends and Key Support Levels for Strategic Trading

This article provides an in-depth Elliott Wave analysis of Dr Reddy's Laboratories, highlighting...

Read More >
Salesforce Inc.(CRM) Stocks Elliott Wave Analysis - Stock Movements and Forecast with this in-depth Technical Analysis

Salesforce Inc.(CRM) Stocks Elliott Wave Analysis - Stock Movements and Forecast with this in-depth Technical Analysis

This Salesforce (CRM) stock analysis applies the Elliott Wave Theory to both daily and 1-hour charts...

Read More >

$1 for 2 Weeks

then $29 a month!

What a Special Offer!

Trade Recommendations

Unleash the power of deversified trading with our comprehensive portfolio, covering 250+ markets:

  • Stock Trades
  • Crypto Trades
  • Forex Trades
  • Commodity Trades
Elliott Wave Analysis

Gain a competitive edge with expert insights and AI-powered Elliott Wave charting into:

  • Global Indices
  • US Stocks & ASX Stocks
  • Forex & Crypto
  • Commodities
Top-Notch Trading Tools

Equip yourself with the tools of success:

  • Real-time Chat rooms
  • Elliott Wave Algorithm
  • Portfolio tools
  • TradingLevels
  • Screener
  • Trading Game
7 Elliott Wave Analysts

Stay ahead of the market with daily charts and insightful videos
Your secret to strategic trading!

JOIN HERE


Welcome to TradingLounge (ASIC A.R.No. 321187), specialists in trades, trading education and technical analysis, covering stocks, indices, commodities, forex and cryptocurrencies.

When you join TradingLounge you have access to everything we offer, including trade tools, educational content and a social platform to chat with like-minded investors.

Read more

@Copyright 2024 by tradinglounge.com

Contact Us

Australian no: 02 4787 6020

International no: +61 (2) 47876020

Pay with:

Find us on