20May

Shanghai Composite Index Elliott Wave Forecast: Bullish Wave 3 Trend Explained with Daily and Weekly Chart Analysis

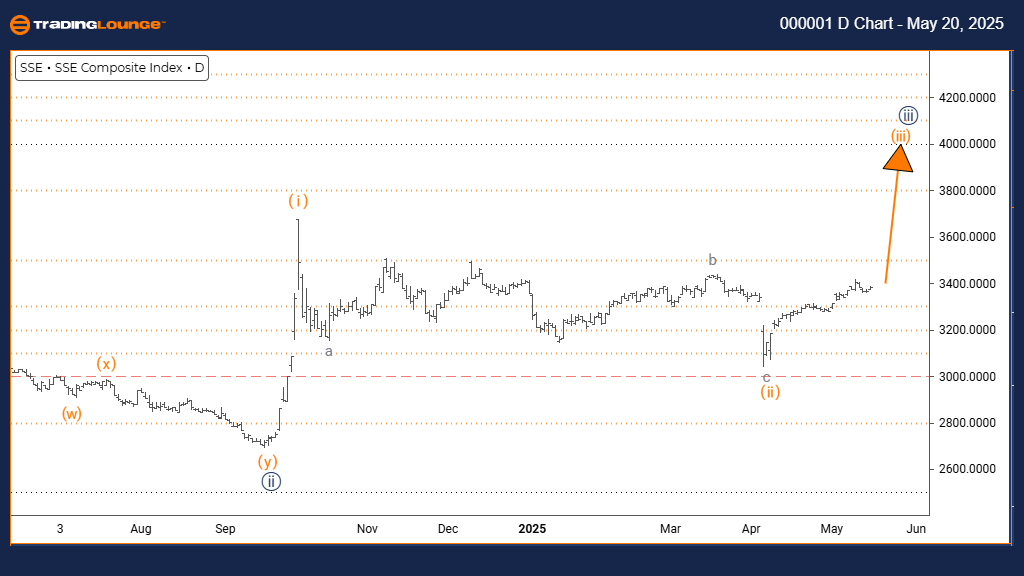
Shanghai Composite Elliott Wave Analysis – Trading Lounge Daily Chart

Shanghai Composite Technical Analysis – Daily Timeframe

FUNCTION: Trend

MODE: Impulsive

STRUCTURE: Orange Wave 3

POSITION: Navy Blue Wave 3

NEXT HIGHER DEGREE DIRECTION: Orange Wave 3 (Ongoing)

DETAILS: Orange wave 2 looks complete; orange wave 3 of 3 has begun.

The Shanghai Composite Index daily chart shows a solid bullish trend, supported by a classic Elliott Wave impulse structure. The current pattern places orange wave 3 within a broader navy blue wave 3, indicating the end of the orange wave 2 correction and the beginning of a strong upward move.

As orange wave 3 takes hold, the chart reflects clear buying momentum. This phase often marks a period where many traders recognize the trend, adding strength to the rally. The ongoing wave could extend significantly before any noticeable correction appears.

This Elliott Wave analysis helps investors understand where the index is within the broader market cycle. The potential for more upward price action remains strong in this wave 3, but caution is advised as it progresses toward a natural correction phase. Monitoring wave completion signals is essential for effective position management.

Shanghai-d-index-cha...


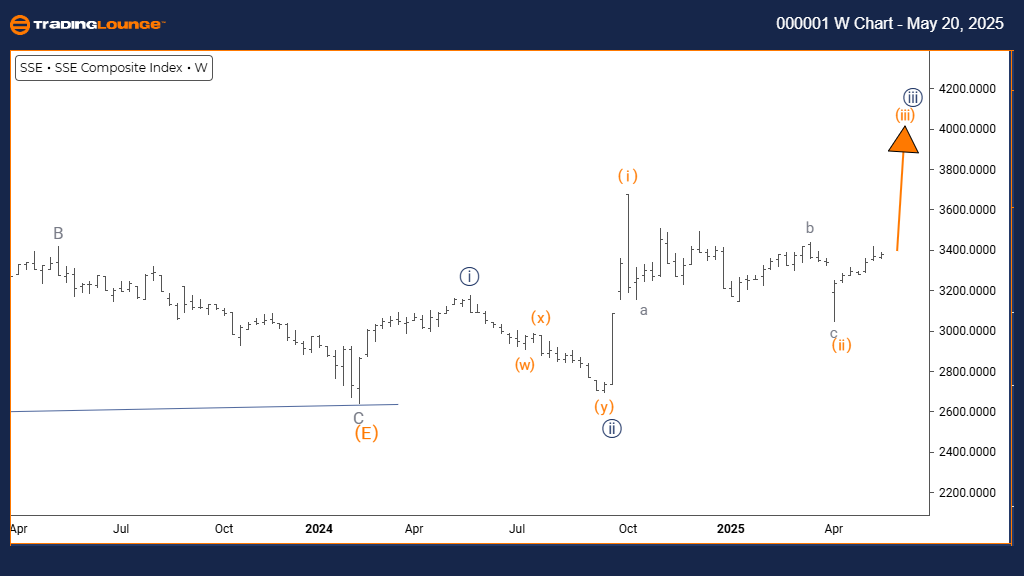
Shanghai Composite Elliott Wave Analysis – Trading Lounge Weekly Chart

Shanghai Composite Technical Analysis – Weekly Timeframe

FUNCTION: Trend

MODE: Impulsive

STRUCTURE: Orange Wave 3

POSITION: Navy Blue Wave 3

NEXT LOWER DEGREE DIRECTION: Orange Wave 4

DETAILS: Orange wave 2 looks complete; orange wave 3 of 3 remains active.

On the Shanghai Composite weekly chart, the Elliott Wave structure indicates a continuing bullish trend. Orange wave 3 is unfolding within navy blue wave 3, following a completed orange wave 2. This supports a strong upward movement that fits the typical profile of an impulsive wave.

This current wave reflects heavy buying pressure, potentially driven by large-scale investors. Orange wave 3 is usually one of the most extended and powerful phases in Elliott Wave theory, suggesting a sustained rally with room to grow.

For traders, this wave count offers long-term insight into the market’s trajectory. While momentum is currently strong, preparation for orange wave 4 is necessary once wave 3 begins to lose steam. Effective risk management and regular structure assessments will help navigate this phase of the Elliott Wave cycle.\

Technical Analyst: Malik Awais

Source: Visit Tradinglounge.com and learn from the Experts. Join TradingLounge Here 

Previous: S&P 500 Elliott Wave Technical Analysis

VALUE Offer - Buy 1 Month & Get 3 Months!Click here

Access 7 Analysts Over 200 Markets Covered. Chat Room With Support

Shanghai-w-index-cha...


Exclusive TradingLounge Offer: $1 Two-Week Trial, then $29 Per Month -  58% Discount NOW

Access 8 analysts, 250+ markets, real-time chat rooms, AI-powered Elliott Wave charting, and portfolio tools.

Claim This Deal Now


Related

Stay informed with our expert insights: Visa Inc. (V) Stocks Elliott Wave Technical Analysis

Stay informed with our expert insights: Visa Inc. (V) Stocks Elliott Wave Technical Analysis

Get the latest Elliott Wave analysis for Visa Inc. (V) as of June 13, 2024. Our detailed review cove...

Read More >
DOW JONES (DJI) Index Elliott Wave Technical Analysis Identifies Current Market Trends Help Traders to Navigate Movements

DOW JONES (DJI) Index Elliott Wave Technical Analysis Identifies Current Market Trends Help Traders to Navigate Movements

DOW JONES (DJI) Elliott Wave Analysis identifies current market trends and wave patterns to help tra...

Read More >
Global Stock Market Indices: In-Depth Elliott Wave Analysis of S&P 500, NASDAQ 100, DAX 40 & More

Global Stock Market Indices: In-Depth Elliott Wave Analysis of S&P 500, NASDAQ 100, DAX 40 & More

This analysis provides a comprehensive overview of the S&P 500, NASDAQ 100, Russell 2000, DAX 40, FT...

Read More >
NASDAQ Elliott Wave Analysis: SPX, JPM, AAPL, AMZN, NVDA, TSLA, GOOGL, META, NFLX, MSFT 2024 Forecast

NASDAQ Elliott Wave Analysis: SPX, JPM, AAPL, AMZN, NVDA, TSLA, GOOGL, META, NFLX, MSFT 2024 Forecast

This article offers a detailed Elliott Wave analysis of the NASDAQ stock market, focusing on key tec...

Read More >
Our analysis includes daily and 4-hour chart insights: NVIDIA Corp.(NVDA) Stocks Elliott Wave Technical Analysis

Our analysis includes daily and 4-hour chart insights: NVIDIA Corp.(NVDA) Stocks Elliott Wave Technical Analysis

Explore our detailed NVIDIA Elliott Wave Analysis to understand the current and potential future mov...

Read More >

$1 for 2 Weeks

then $29 a month!

What a Special Offer!

Trade Recommendations

Unleash the power of deversified trading with our comprehensive portfolio, covering 250+ markets:

  • Stock Trades
  • Crypto Trades
  • Forex Trades
  • Commodity Trades
Elliott Wave Analysis

Gain a competitive edge with expert insights and AI-powered Elliott Wave charting into:

  • Global Indices
  • US Stocks & ASX Stocks
  • Forex & Crypto
  • Commodities
Top-Notch Trading Tools

Equip yourself with the tools of success:

  • Real-time Chat rooms
  • Elliott Wave Algorithm
  • Portfolio tools
  • TradingLevels
  • Screener
  • Trading Game
7 Elliott Wave Analysts

Stay ahead of the market with daily charts and insightful videos
Your secret to strategic trading!

JOIN HERE


Welcome to TradingLounge (ASIC A.R.No. 321187), specialists in trades, trading education and technical analysis, covering stocks, indices, commodities, forex and cryptocurrencies.

When you join TradingLounge you have access to everything we offer, including trade tools, educational content and a social platform to chat with like-minded investors.

Read more

@Copyright 2024 by tradinglounge.com

Contact Us

Australian no: 02 4787 6020

International no: +61 (2) 47876020

Pay with:

Find us on