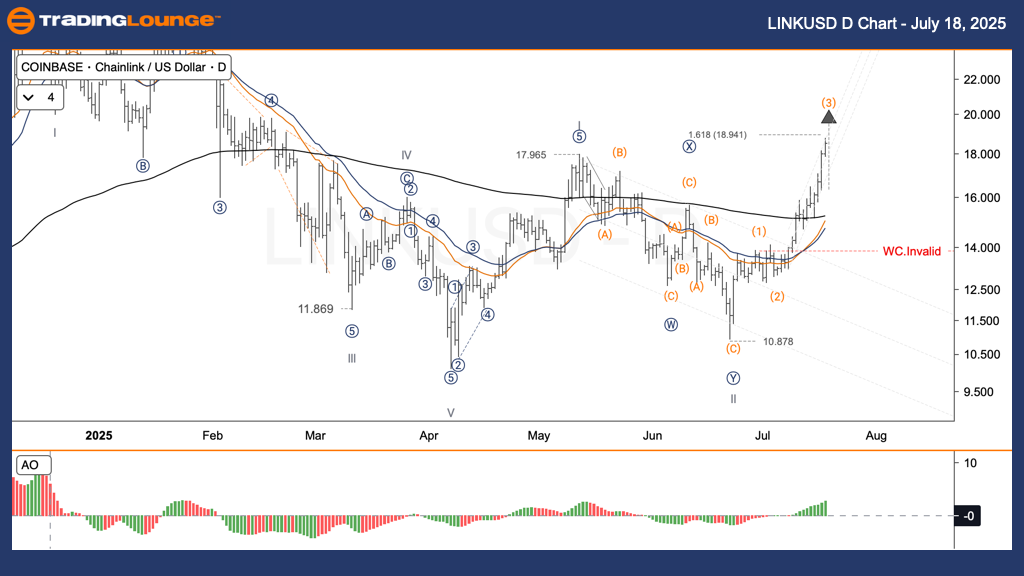
Chainlink /U.S. Dollar TradingLounge Daily Chart – LINKUSD Elliott Wave Forecast
Chainlink /U.S. Dollar Daily Chart Overview
LINKUSD Elliott Wave Technical Analysis
FUNCTION: Trend
MODE: Motive
STRUCTURE: Impulse
POSITION: Wave (3) of ((1))
DIRECTION: Bullish Momentum
Technical Overview:
- Wave I peaked at $17.965
- Wave II found support at $10.87
- Current price movement is forming wave (3) of III
- Wave (3) has a projected 1.618 Fibonacci extension near $18.94
Anticipated resistance zone: $20.00–$22.00
Trading Strategy Recommendations:
Swing Traders' Insight:
- If LINKUSD remains inside the ascending channel and stays above $13.50, bullish momentum continues.
- A powerful wave (3) rally may push prices beyond the 2000 Fibonacci Extension.
🟥 Invalidation Scenario:
- A decline below $13.50 would invalidate the current Elliott Wave impulse count.
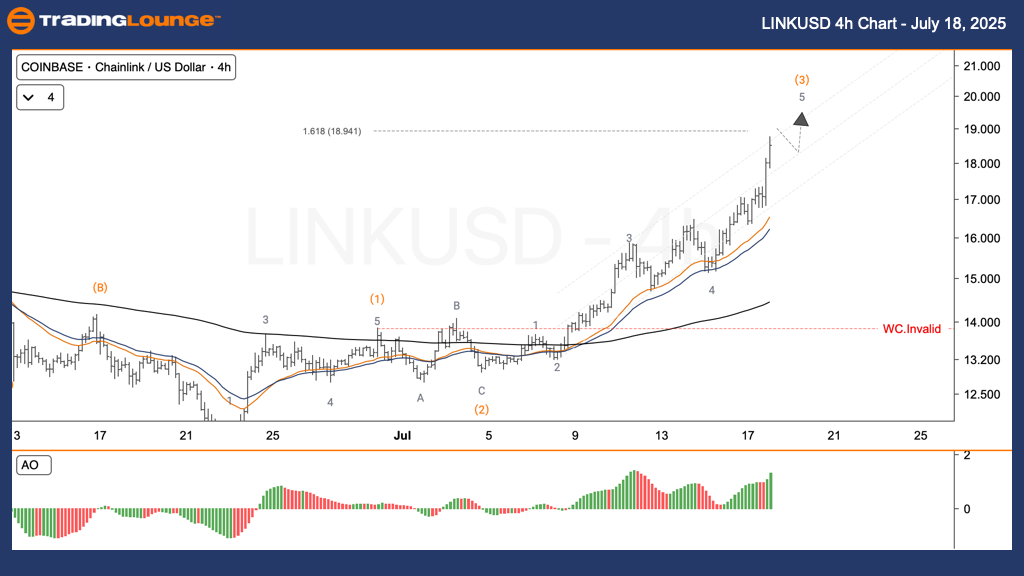
LINKUSD 4H Chart – Elliott Wave Forecast
LINKUSD Elliott Wave Analysis | TradingLounge
FUNCTION: Trend
MODE: Motive
STRUCTURE: Impulse
POSITION: Wave (3) of ((1))
DIRECTION: Bullish Momentum
Technical Overview:
- Wave I reached a high at $17.965
- Wave II corrected to $10.87
- Market action is now developing wave (3) of III
- Projected 1.618 Fibonacci extension for wave (3): $18.94
- Psychological resistance expected at $20.00–$22.00
Trading Strategy Recommendations:
Swing Traders' Insight:
- If LINKUSD trades above $13.50, the upward wave structure remains valid.
- A strong move within wave (3) could target the 2000 Fibonacci extension level.
Invalidation Scenario:
- A price dip under $13.50 would invalidate the current Elliott Wave count.
Technical Analyst: Kittiampon Somboonsod, CEWA
Source: Visit Tradinglounge.com and learn from the Experts. Join TradingLounge Here
Previous: BTCUSD Elliott Wave Technical Analysis
VALUE Offer - $1 for 2 Weeks then $29 a month!Click here
Access 7 Analysts Over 200 Markets Covered. Chat Room With Support