30Apr

VanEck Rare Earth & Strategic Metals ETF (REMX) Elliott Wave Forecast Predicts Rare Earth Metals Rally with $57 Target

VanEck Rare Earth & Strategic Metals ETF (REMX) – Elliott Wave Technical Analysis – Daily Charts

REMX Elliott Wave Technical Analysis

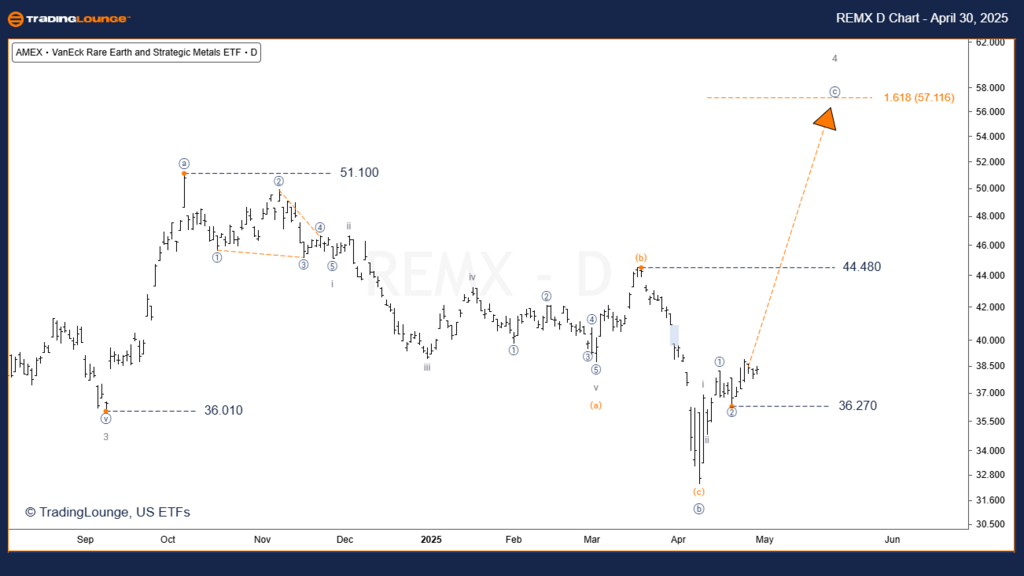
Function: Counter trend

Mode: Corrective

Structure: Expanded Flat

Position: Wave [c] of 4

Direction: Bear market rally

Elliott Wave Details:
Wave 4 of REMX appears to be in its final stages, completing an expanded flat corrective structure.
The ongoing rally is expected to retrace between 38.2% and 50% of the preceding wave 3 decline.
A break above resistance at $51.10 will confirm the expanded flat pattern.
Wave 4 is forecast to terminate around the $57.12 level.
Upon completion, a bearish wave 5 decline is projected to unfold, targeting levels below the origin of wave 4.

Invalidation Level: $32.36

REMX-ETF-4h-chart-30...


VanEck Rare Earth & Strategic Metals ETF (REMX) – Elliott Wave Technical Analysis – 4-Hour Chart

Function: Major Trend (Minor Degree, Grey)

Mode: Motive

Structure: Impulse

Position: Wave [3] of iii

Direction: Rally

Elliott Wave Details:
The REMX 4H chart displays a developing impulsive rally, extending beyond the previous high of $44.48.
Wave [3] is projected to complete between $41.10 and $42.31.
The low of wave (2) is a critical level to watch for confirmation of the bullish trend.
$36.33 acts as both key support and the invalidation level for the impulsive scenario.

Invalidation Level: $36.33

Technical Analyst: Simon Brooks

Source: Visit Tradinglounge.com and learn from the Experts. Join TradingLounge Here 

See Previous: SILJ Elliott Wave Technical Analysis

VALUE Offer - Buy 1 Month & Get 3 Months!Click here

Access 7 Analysts Over 200 Markets Covered. Chat Room With Support

REMX-ETF-day-chart-3...


Conclusion & Strategic Notes
VanEck Rare Earth & Strategic Metals ETF (REMX) shows bullish momentum in the short term, supported by both daily and 4-hour Elliott Wave structures.
Price action is expected to break above wave [a], with a primary target of $57.12, aligning wave [c] with wave [a] in terms of length.
This setup offers a compelling opportunity for traders focused on ETF market timing.
Maintaining discipline by adhering to Elliott Wave principles and respecting invalidation levels will help manage trading risk effectively.

Related

Cardano/ U.S. dollar(ADAUSD) Elliott Wave Technical Analysis 7 November 23

Cardano/ U.S. dollar(ADAUSD) Elliott Wave Technical Analysis 7 November 23

ADAUSD Crypto Analysis - Cardano/ U.S. dollar(ADAUSD) Elliott Wave Technical Analysis on 7 November ...

Read More >
 Australian Dollar/Japanese Yen(AUDJPY) Elliott Wave Technical Analysis: Understanding Market Trends

Australian Dollar/Japanese Yen(AUDJPY) Elliott Wave Technical Analysis: Understanding Market Trends

Explore the AUDJPY Elliott Wave Technical Analysis for February, covering both 4-hour and day charts...

Read More >
USDJPY Elliott Wave Technical Analysis Shows U.S. Dollar/Japanese Yen Forex Currency Pair is Currently in a Downward Trend Phase

USDJPY Elliott Wave Technical Analysis Shows U.S. Dollar/Japanese Yen Forex Currency Pair is Currently in a Downward Trend Phase

The USDJPY currency pair is currently in a downward trend phase according to Elliott Wave analysis. ...

Read More >
Unlock Bovespa Index Insights: Elliott Wave Technical Analysis for Smarter Trading

Unlock Bovespa Index Insights: Elliott Wave Technical Analysis for Smarter Trading

The Bovespa Index Elliott Wave analysis provides in-depth insights into market trends, wave structur...

Read More >
Wesfarmers Limited (WES) Stock: Key Elliott Wave Analysis & WES Share Price Predictions and Explore Strategies on ASX

Wesfarmers Limited (WES) Stock: Key Elliott Wave Analysis & WES Share Price Predictions and Explore Strategies on ASX

This detailed analysis focuses on Wesfarmers Limited (WES) stock using Elliott Wave theory to provid...

Read More >
Current Market Movements in U.S. Dollar / Canadian Dollar Currency Pair | USD/CAD Elliott Wave Technical Analysis

Current Market Movements in U.S. Dollar / Canadian Dollar Currency Pair | USD/CAD Elliott Wave Technical Analysis

This article provides an in-depth USD/CAD Elliott Wave Analysis for both daily and 4-hour charts. It...

Read More >

Buy 1 Month

Get 3 Months!

Special Offer:

Trade Recommendations

Unleash the power of deversified trading with our comprehensive portfolio, covering:

  • Stock Trades
  • Crypto Trades
  • Forex Trades
  • Commodity Trades
Elliott Wave Analysis

Gain a competive edge with expert insights in to:

  • Global Indices
  • US Stocks & ASX Stocks
  • Forex & Crypto
  • Commodities
Top-Notch Trading Tools

Equip yourself with the tools of success:

  • Social Chat
  • Elliott Wave Algorithm
  • Screener
  • TradingLevels
  • Trading Game
7 Elliott Wave Analysts

Stay ahead of the market with daily charts and insightful videos
-Your secret to strategic trading!

JOIN HERE


Welcome to TradingLounge (ASIC A.R.No. 321187), specialists in trades, trading education and technical analysis, covering stocks, indices, commodities, forex and cryptocurrencies.

When you join TradingLounge you have access to everything we offer, including trade tools, educational content and a social platform to chat with like-minded investors.

Read more

@Copyright 2024 by tradinglounge.com

Contact Us

Australian no: 02 4787 6020

International no: +61 (2) 47876020

Pay with:

Find us on